Century 21 People’s Choice Realty Inc., Brokerage
120 MATHESON BLVD E #103
MISSISSAUGA, Ontario
L4Z 1X1

Niagara Falls, Hospital, L2G 1G9
$674,900
Listed by FOREST HILL REAL ESTATE INC..
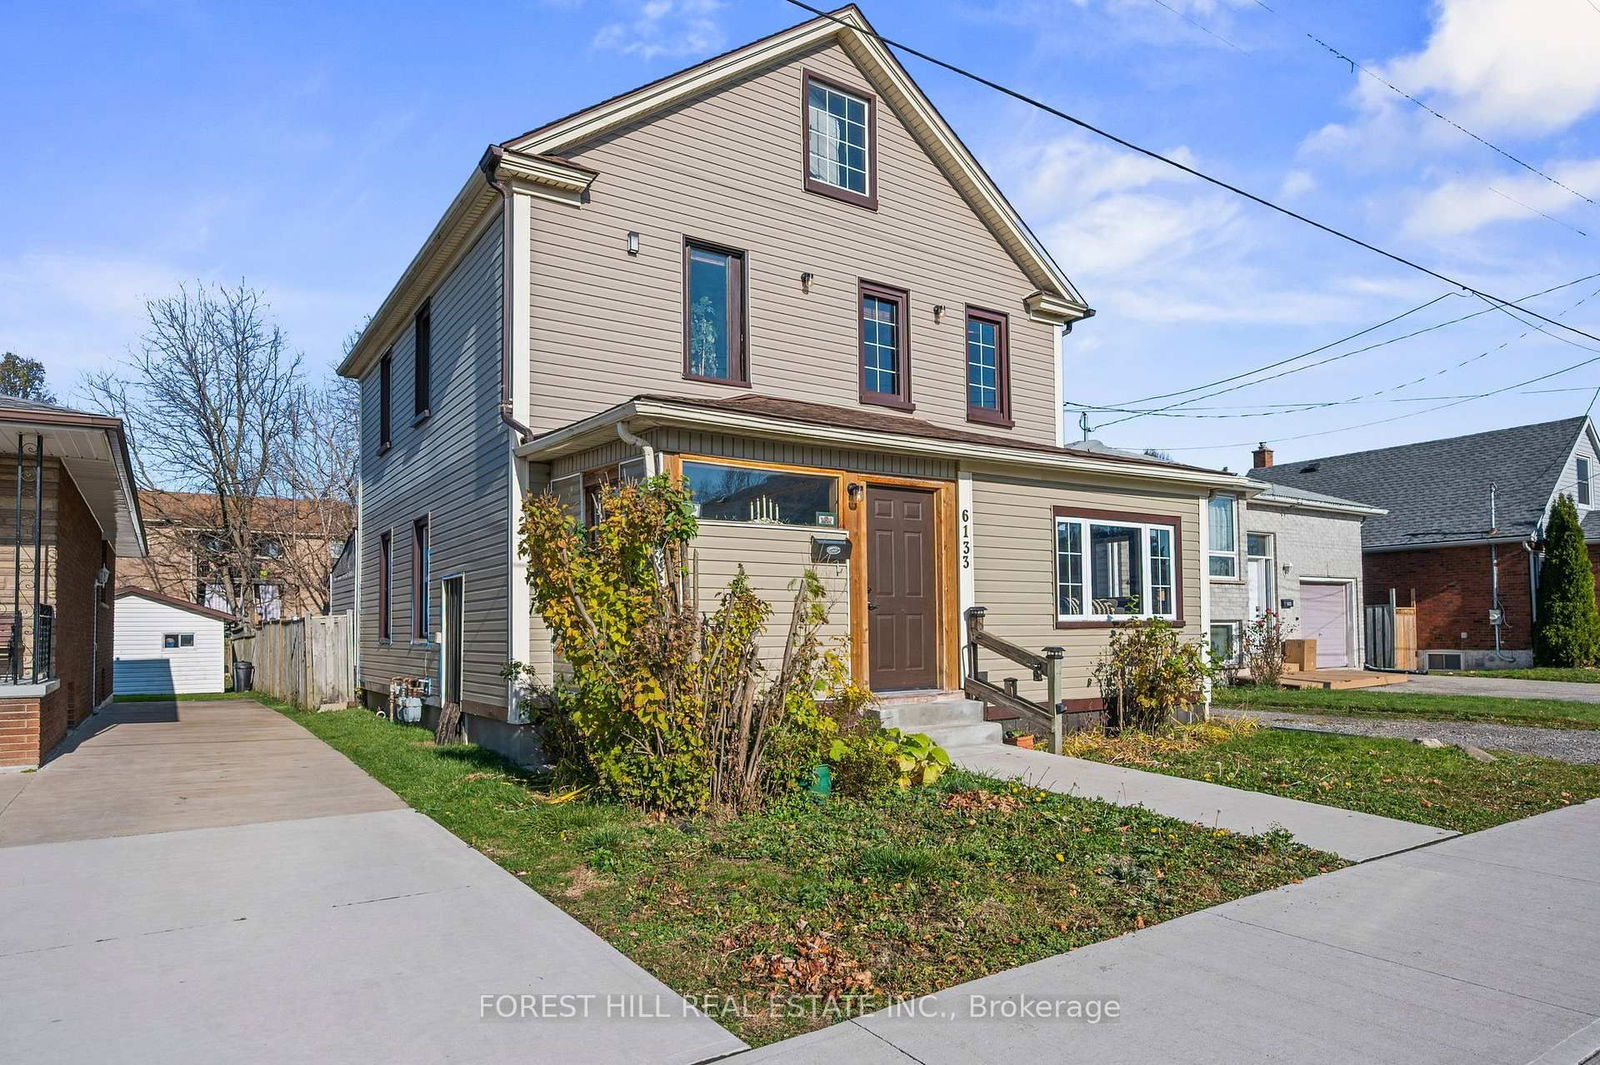
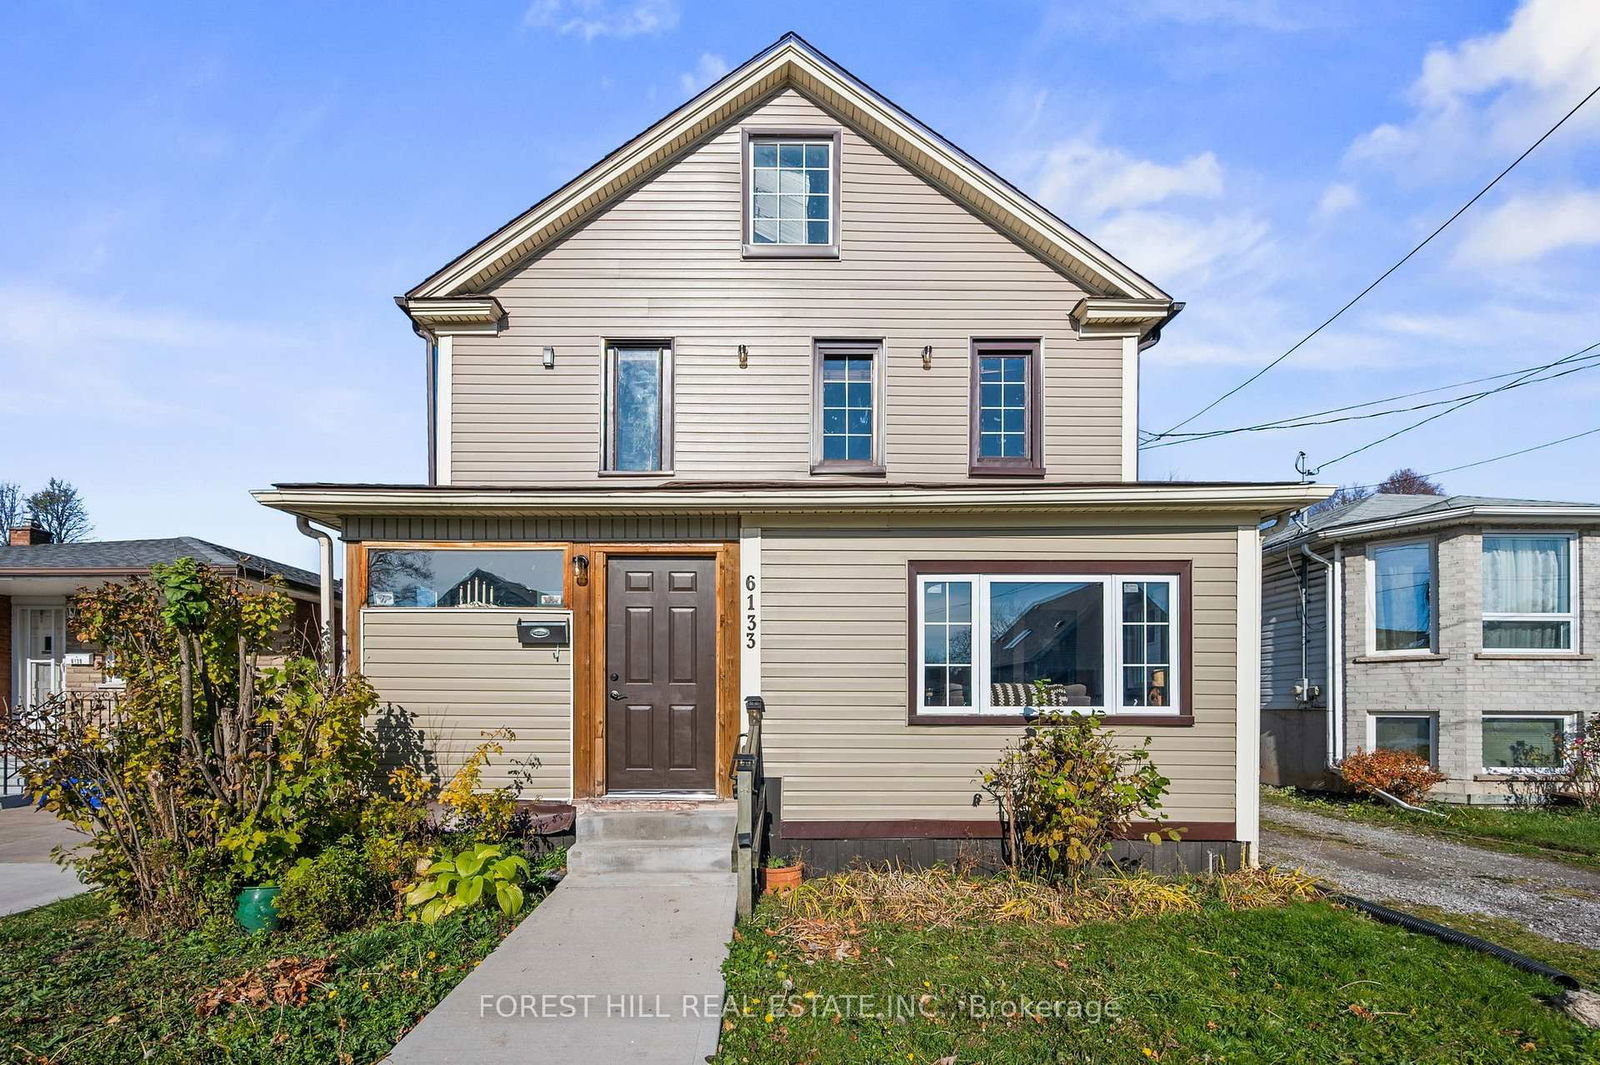
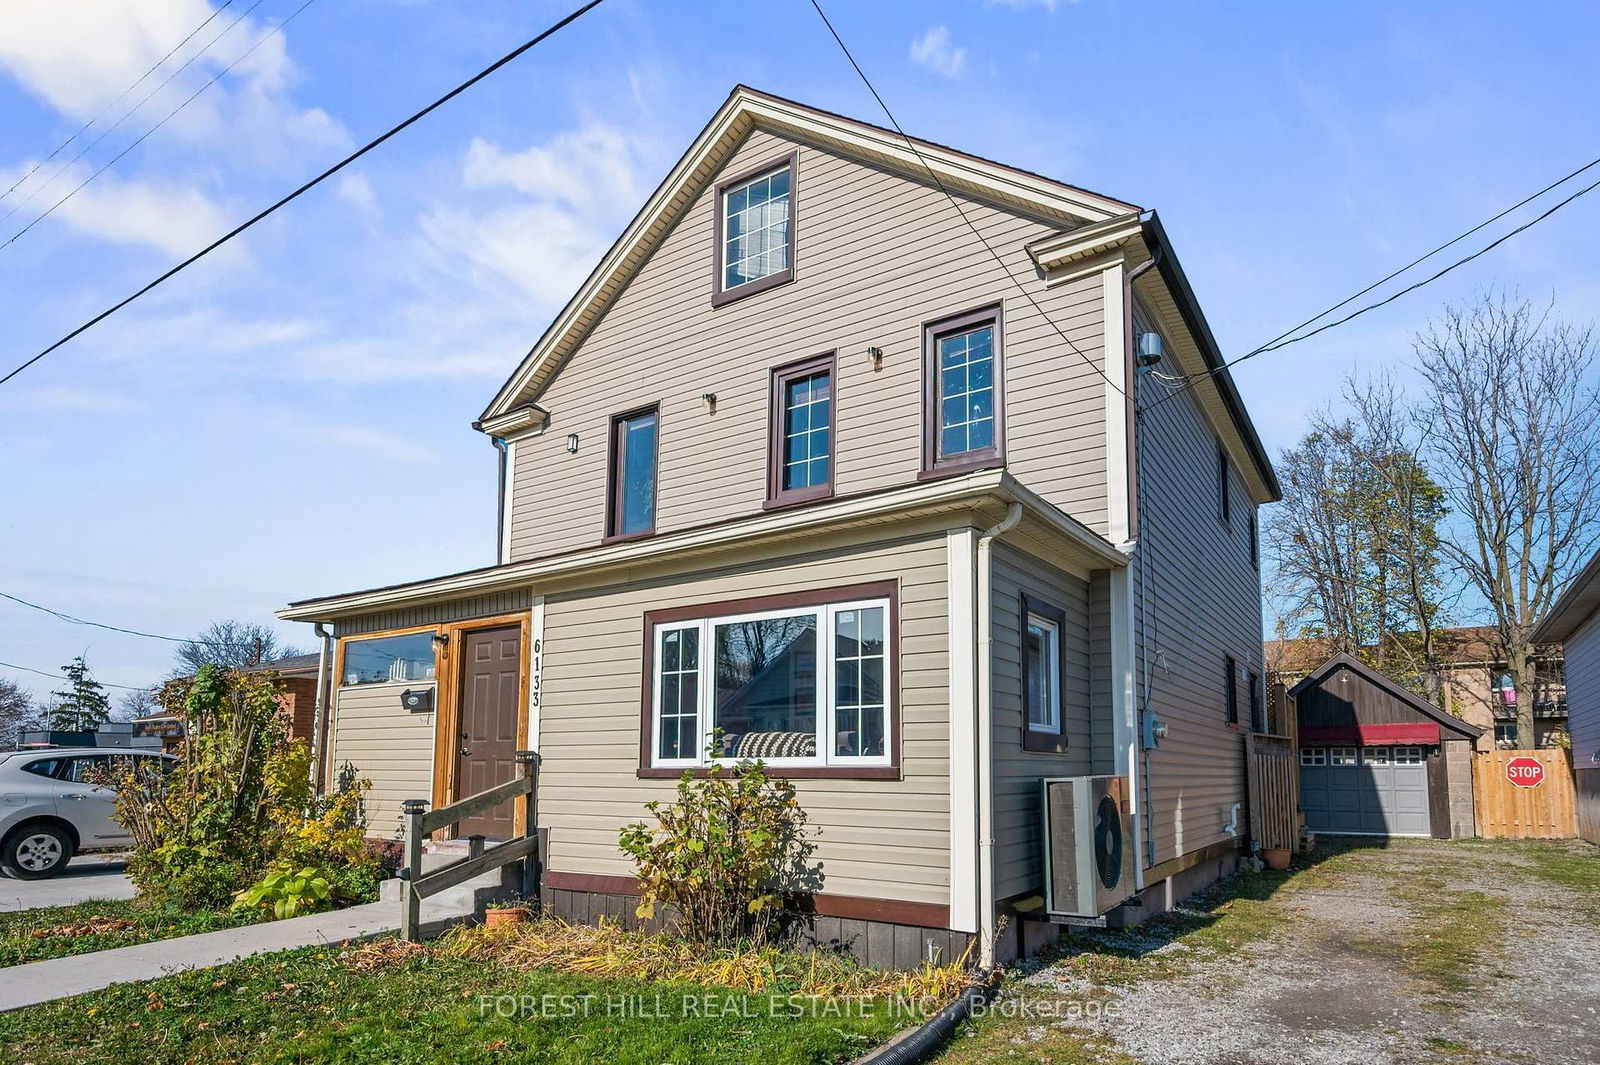
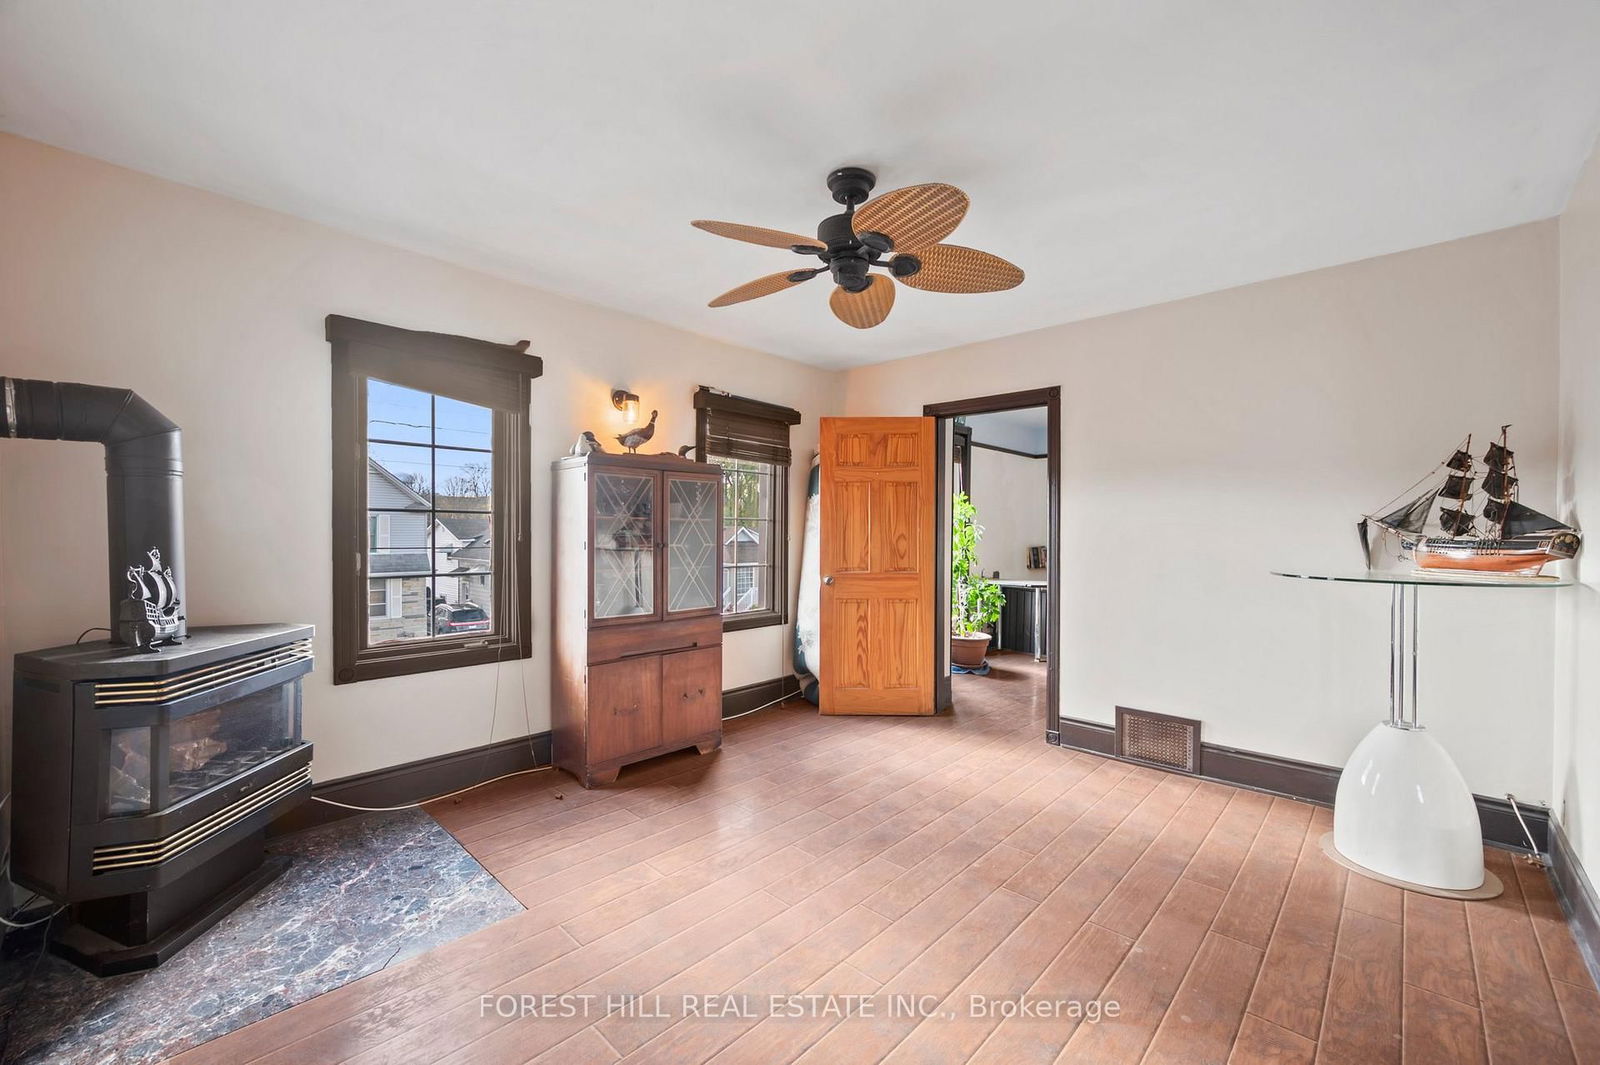
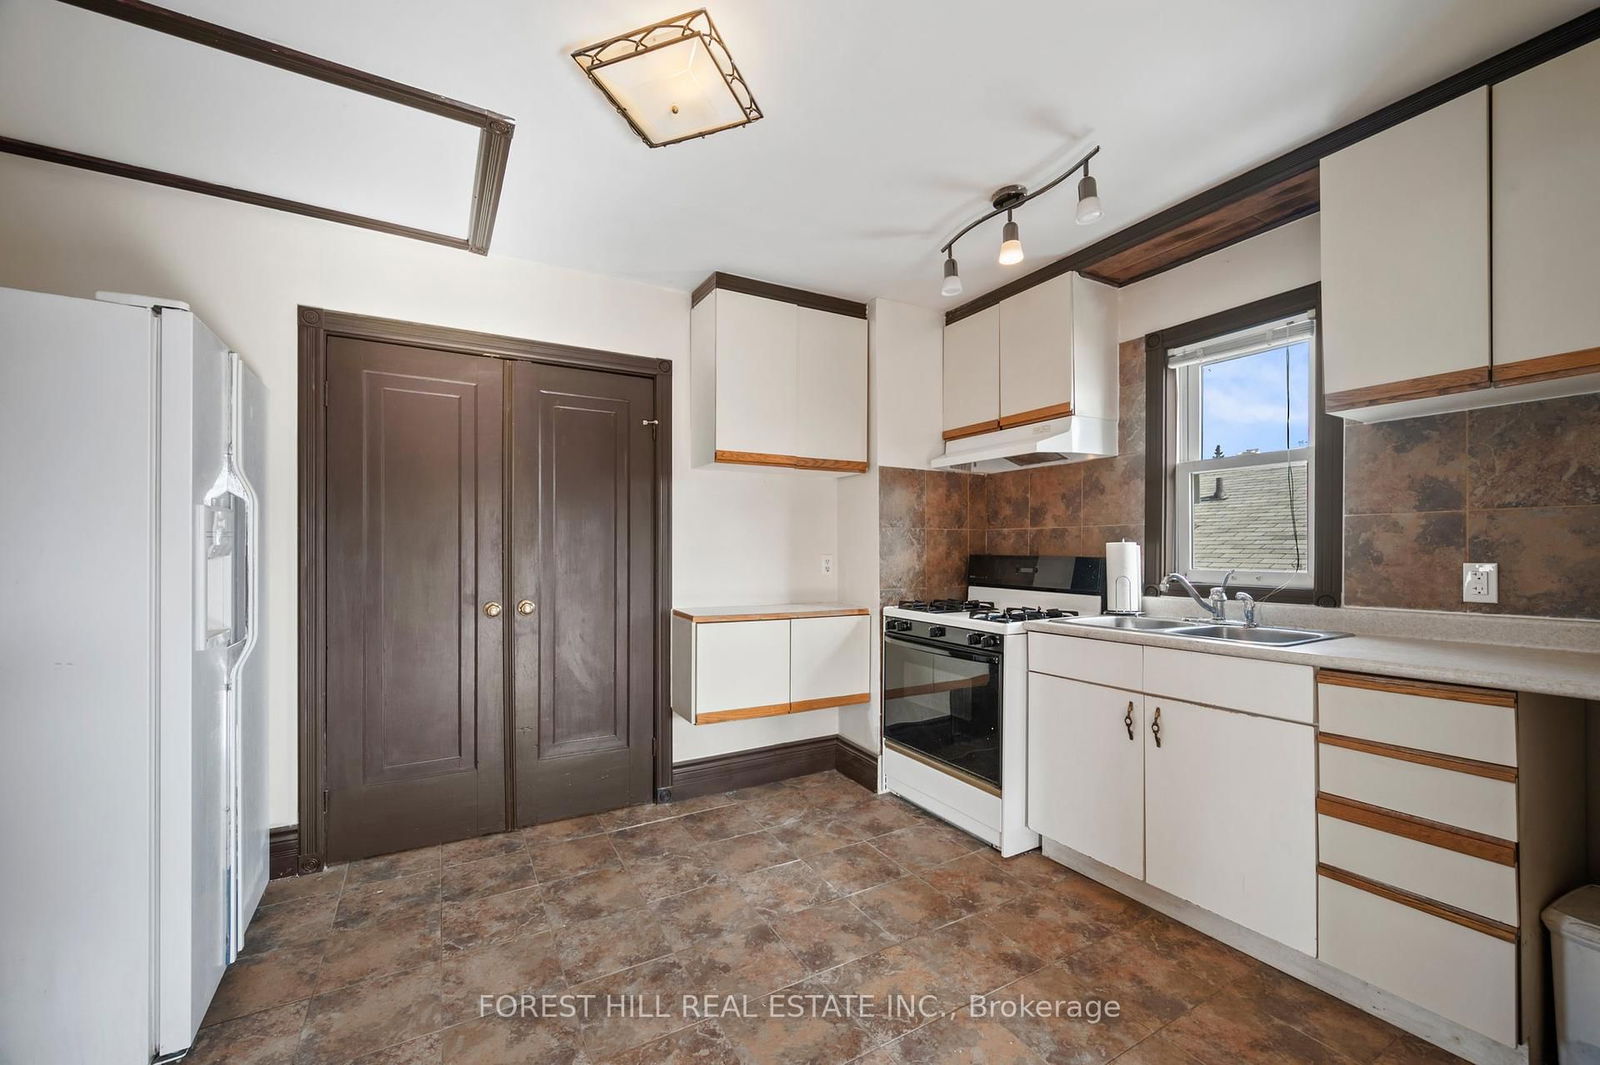
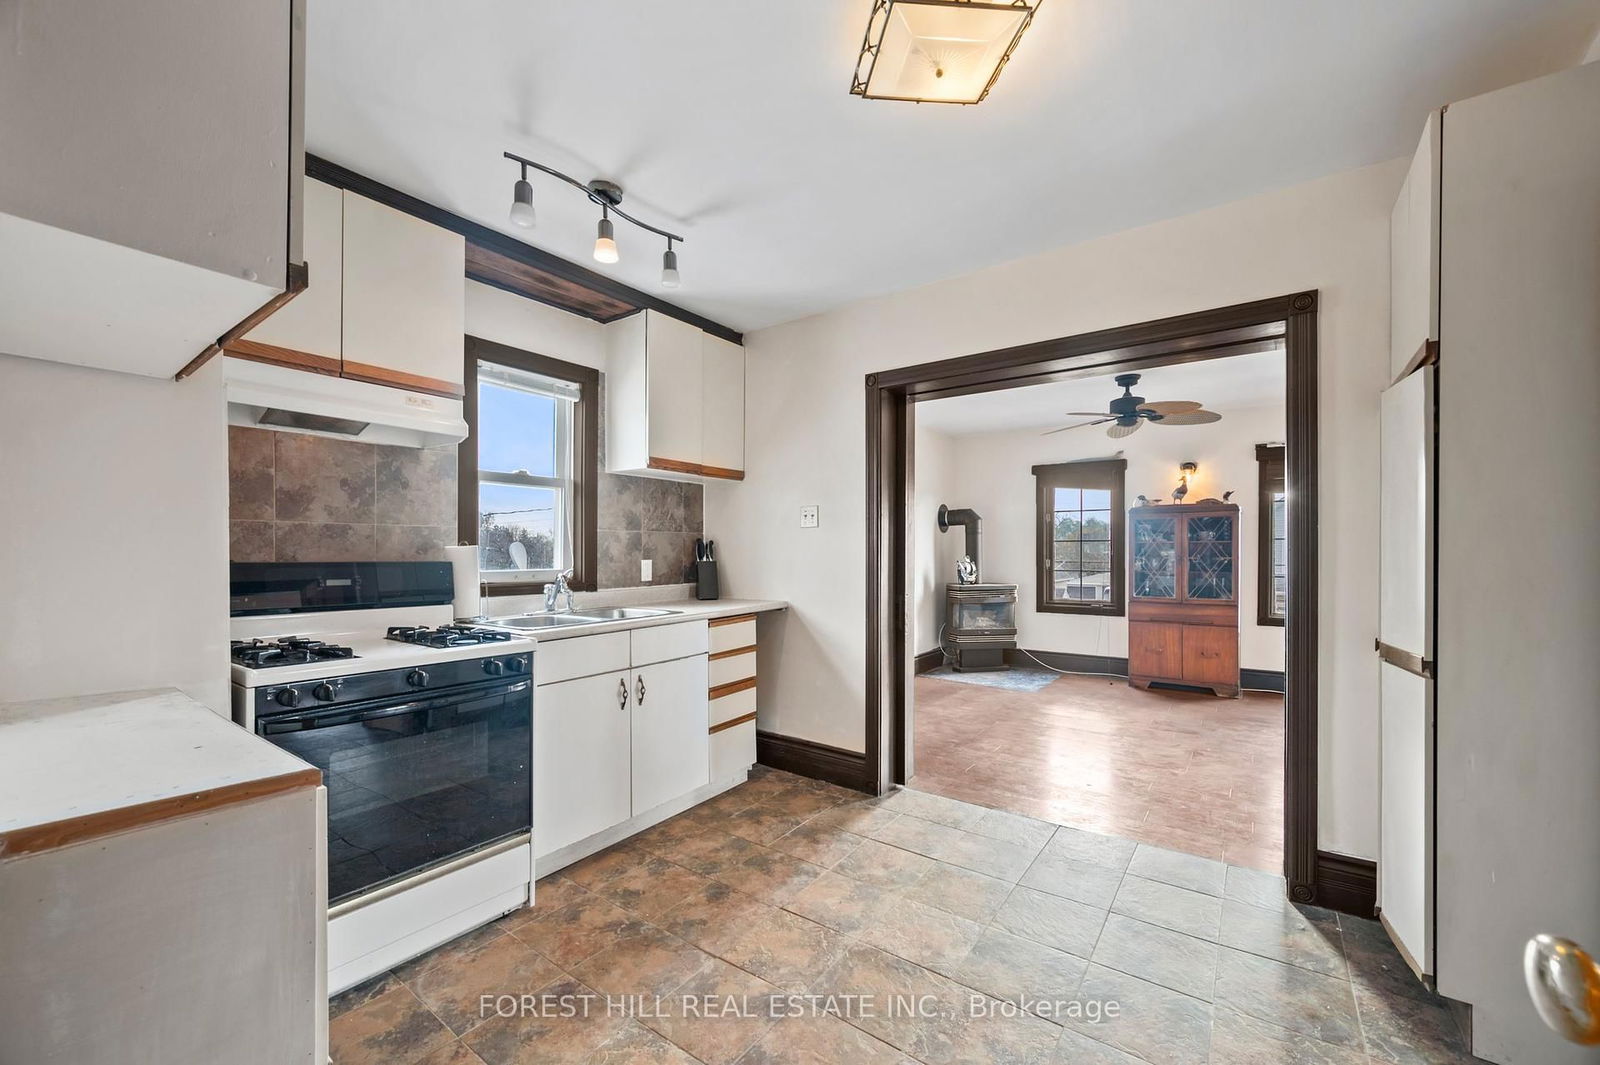
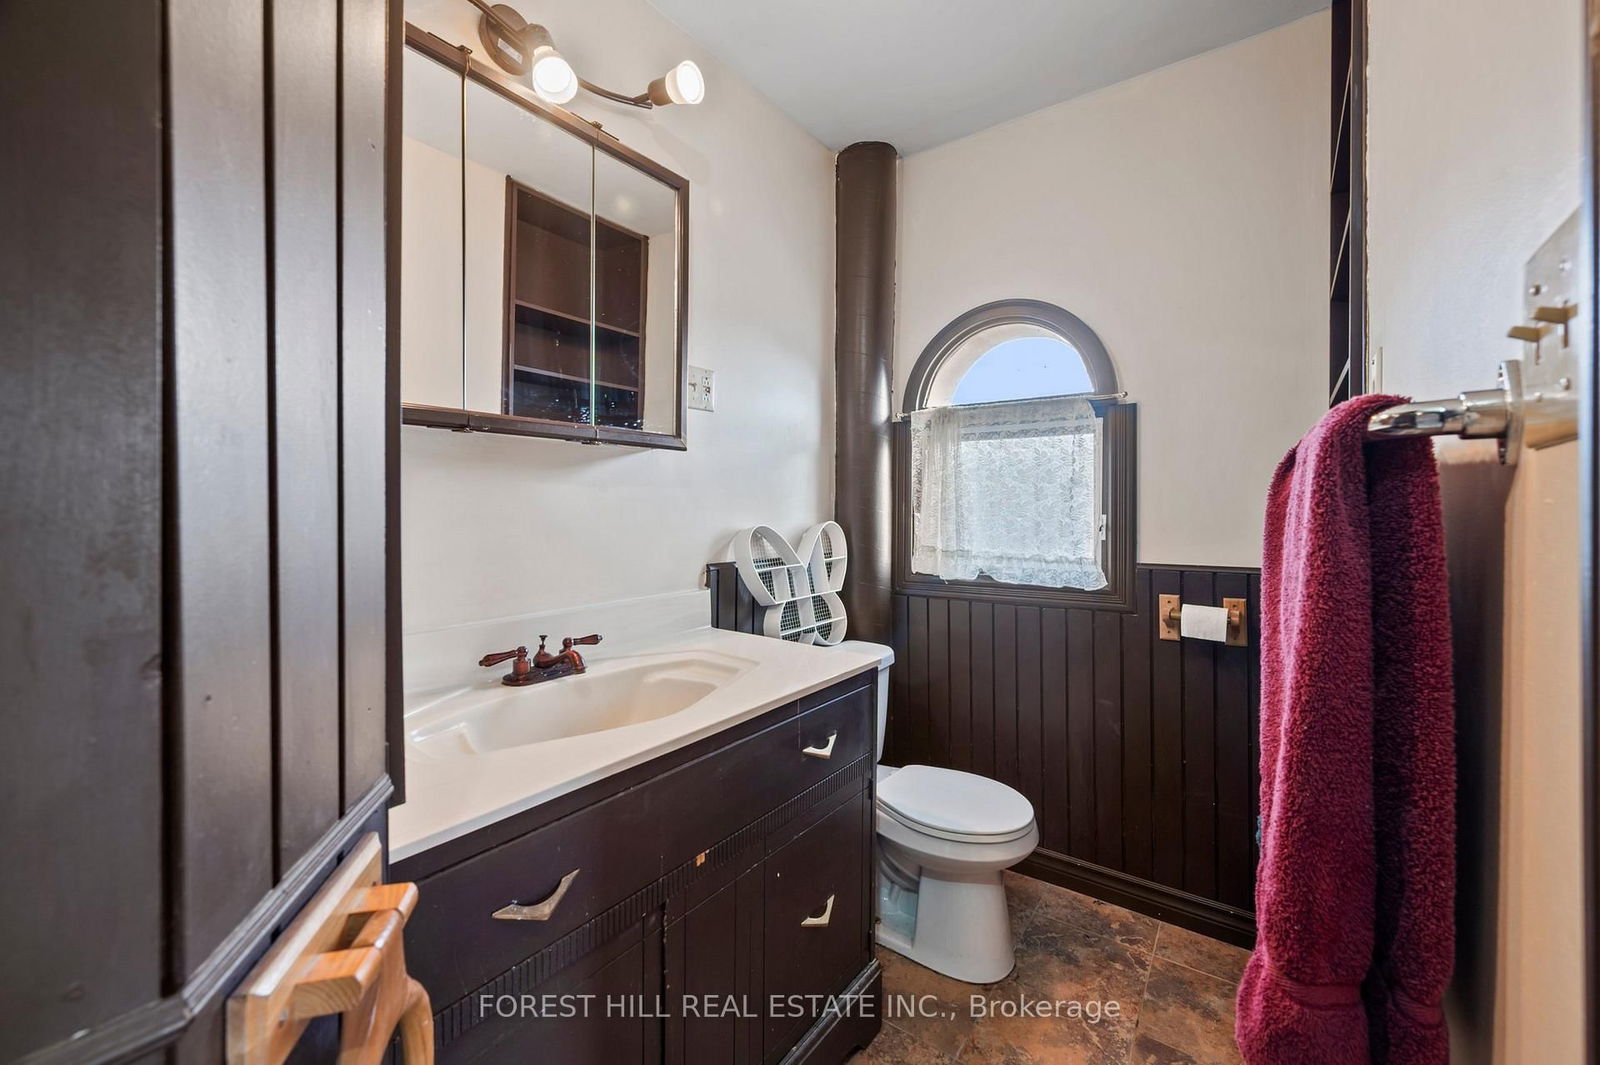
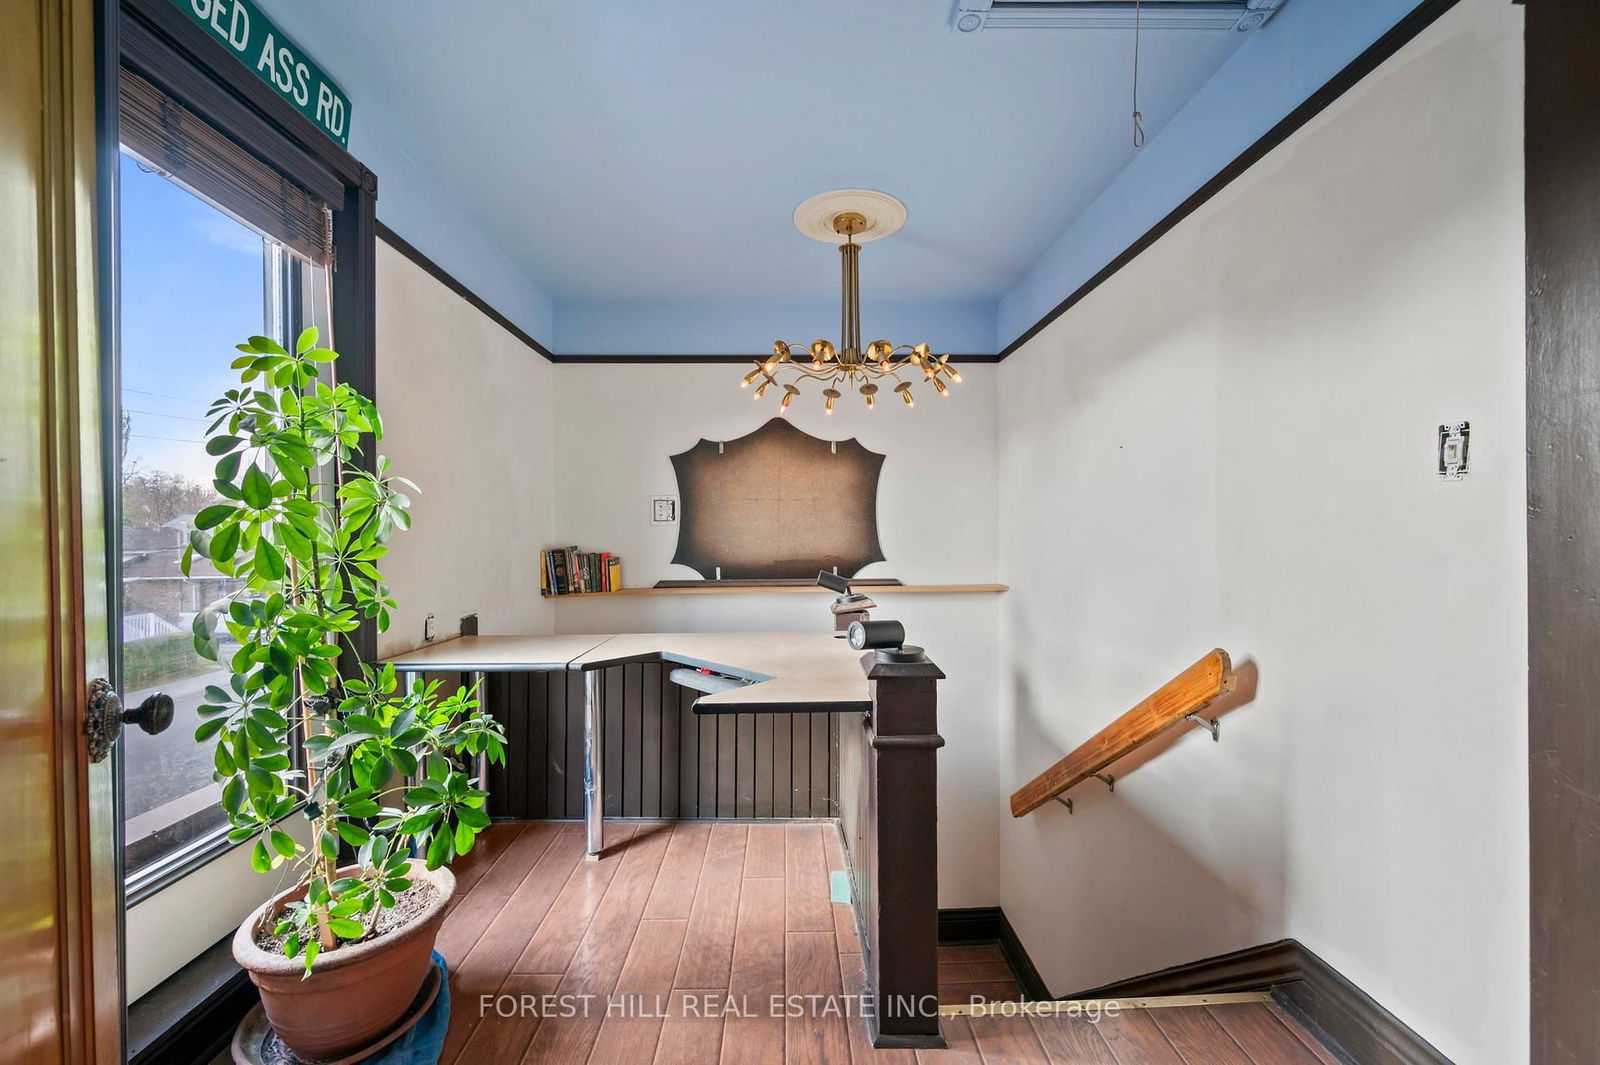
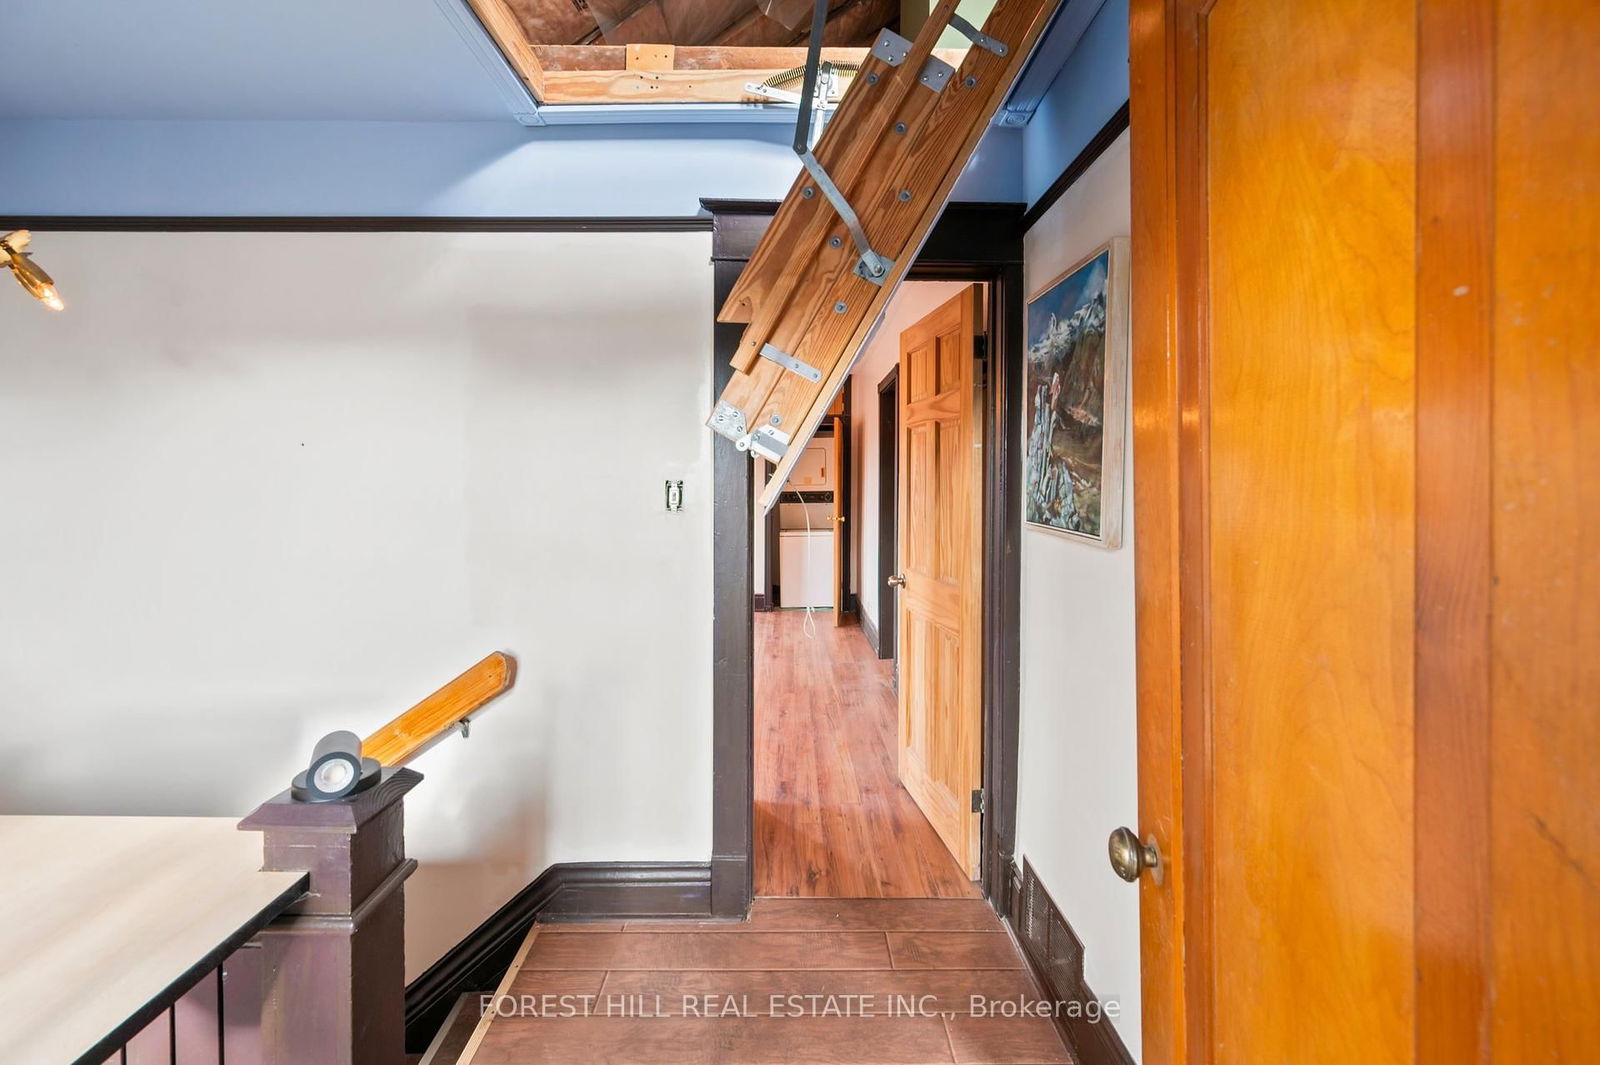
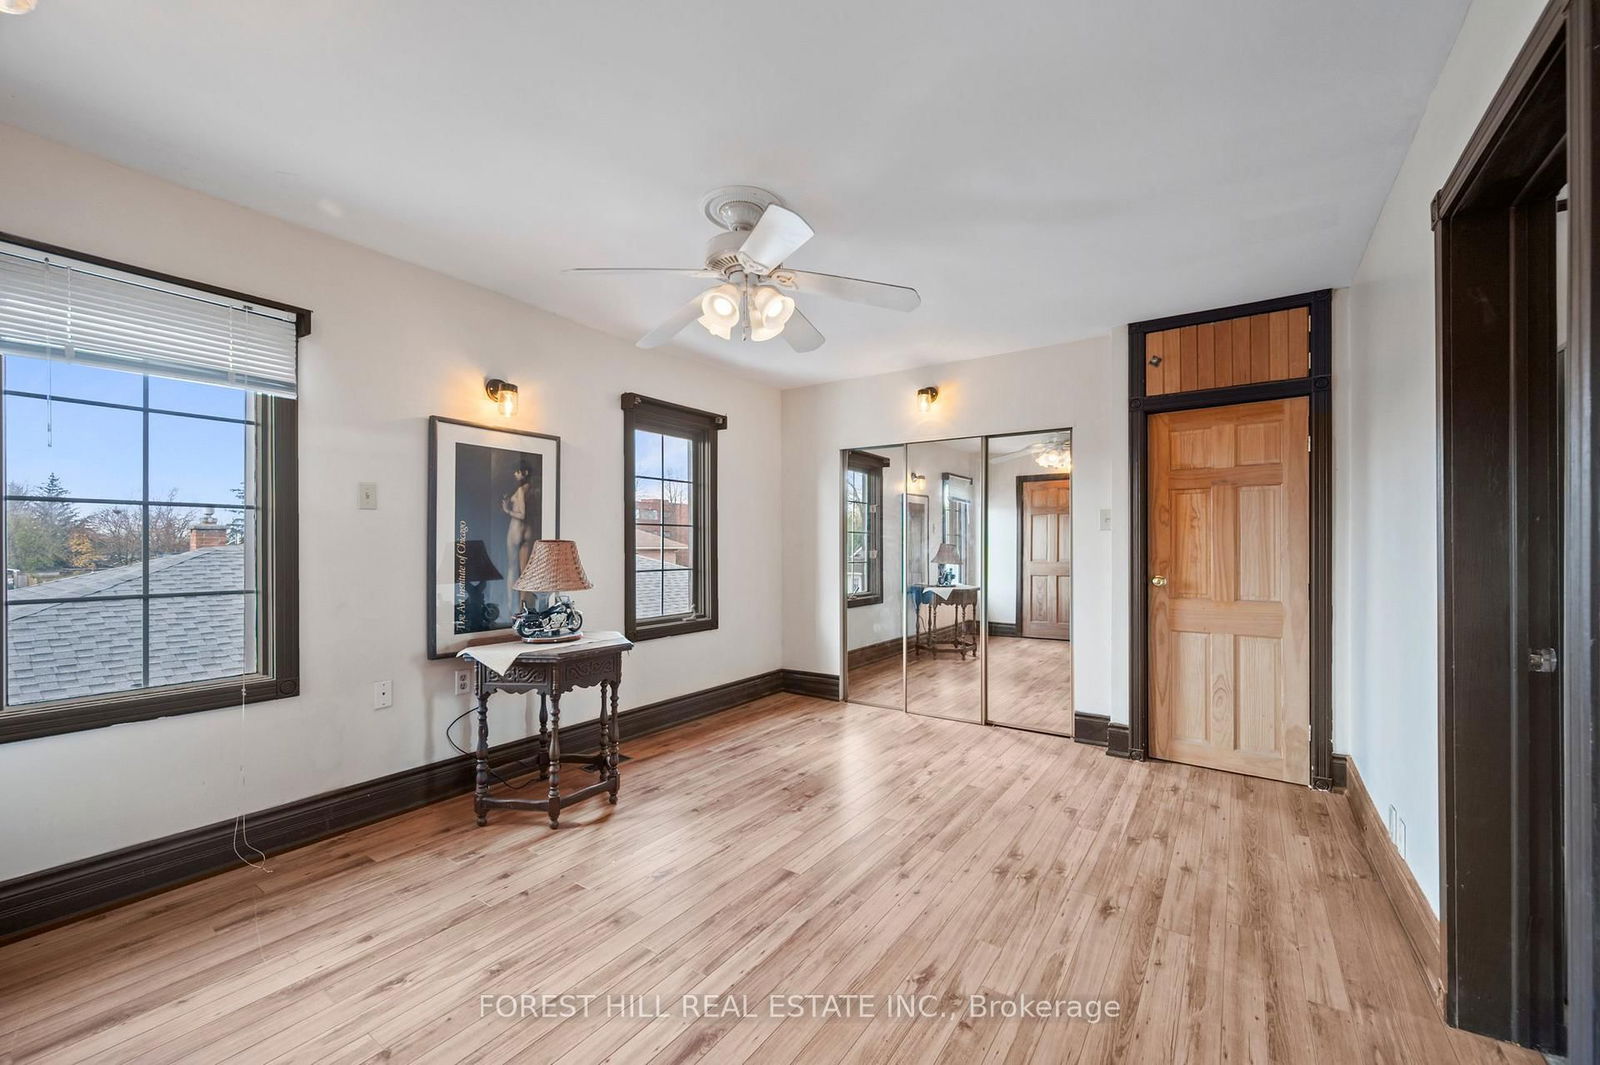
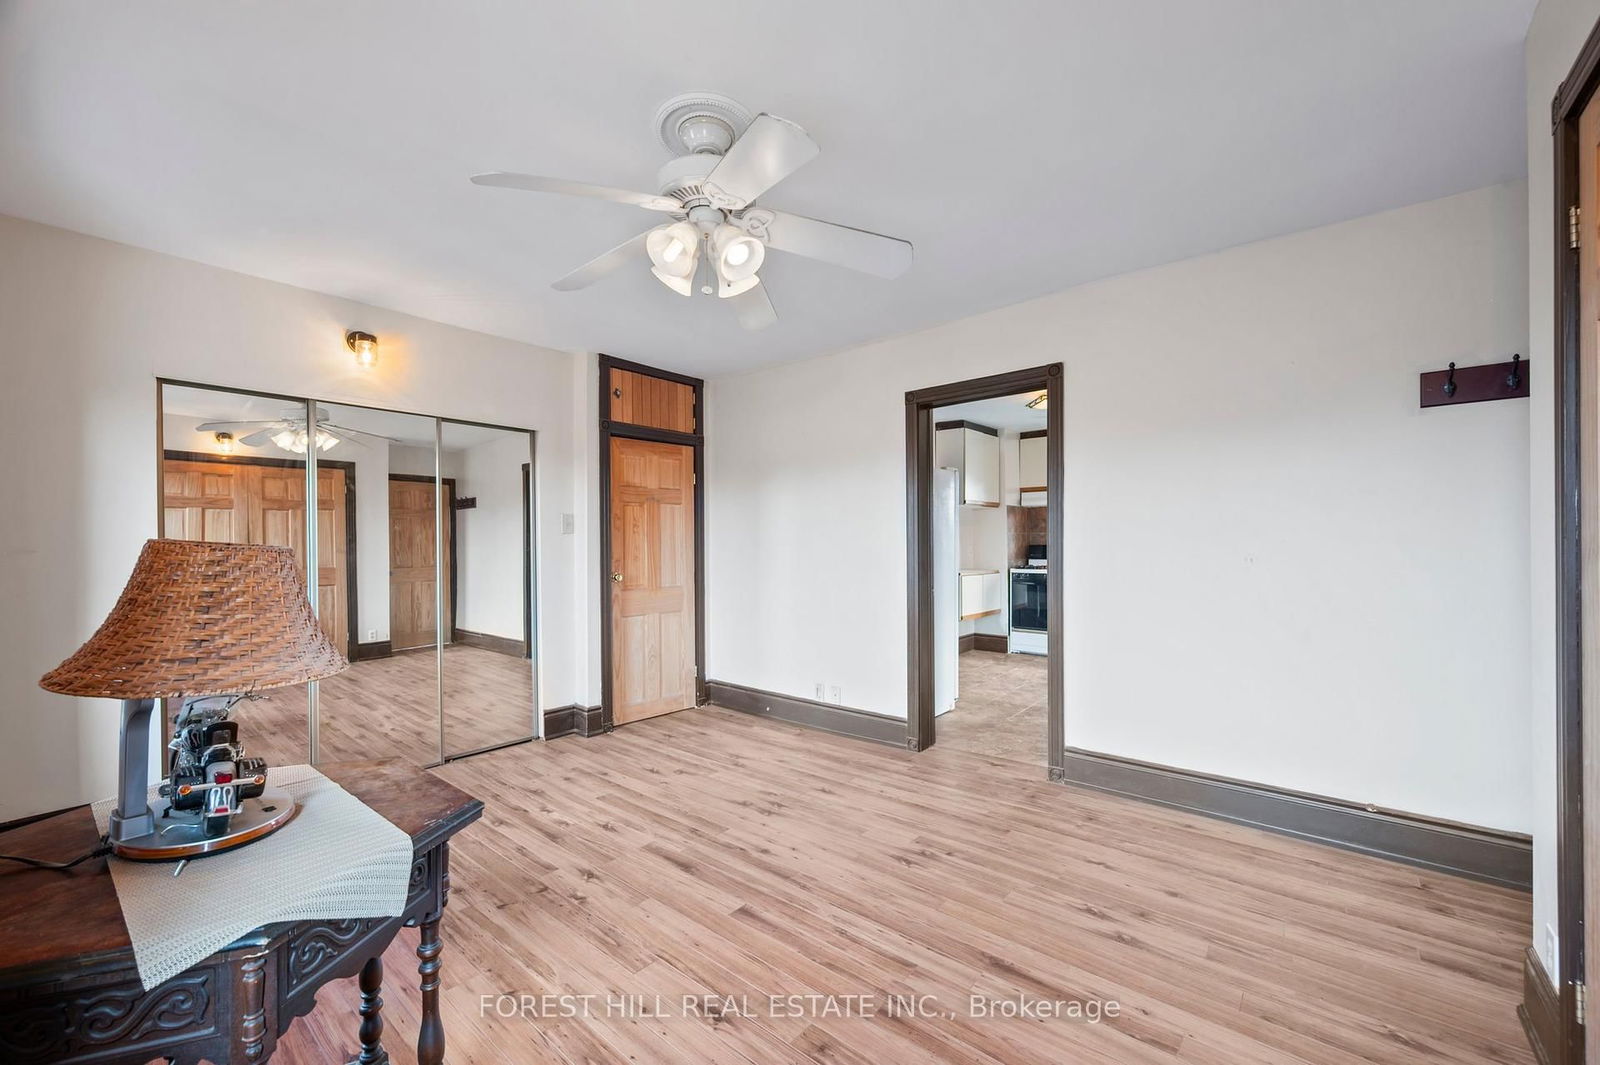
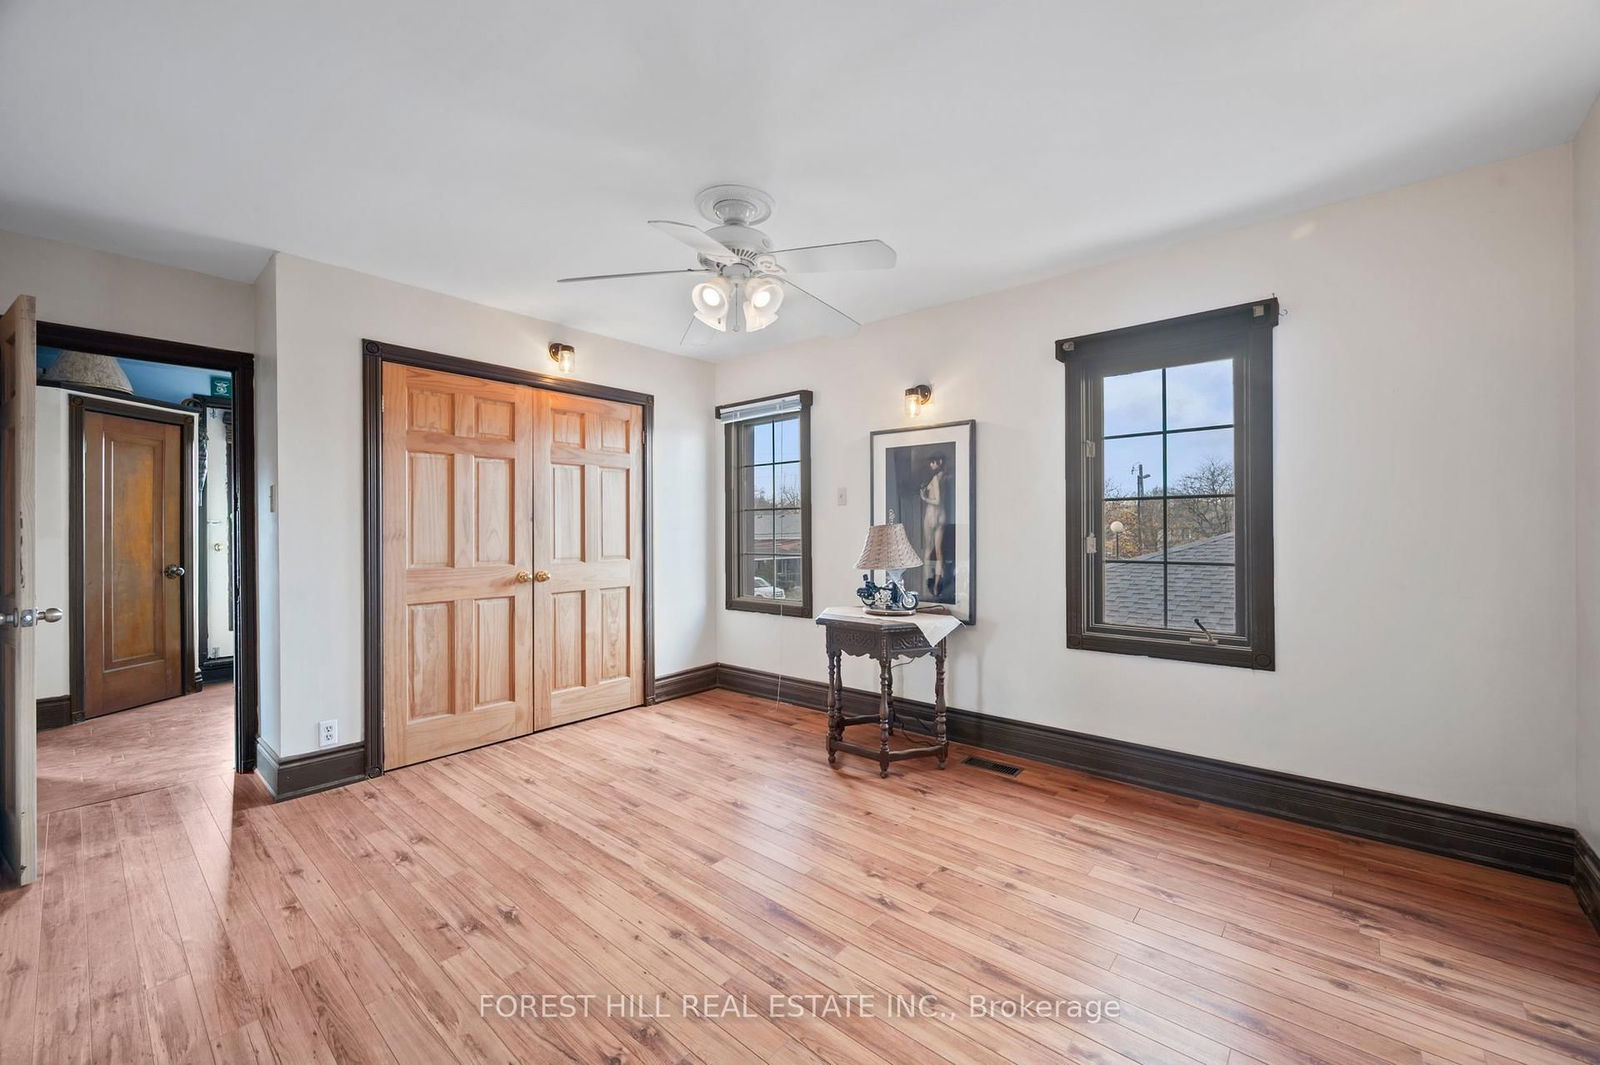
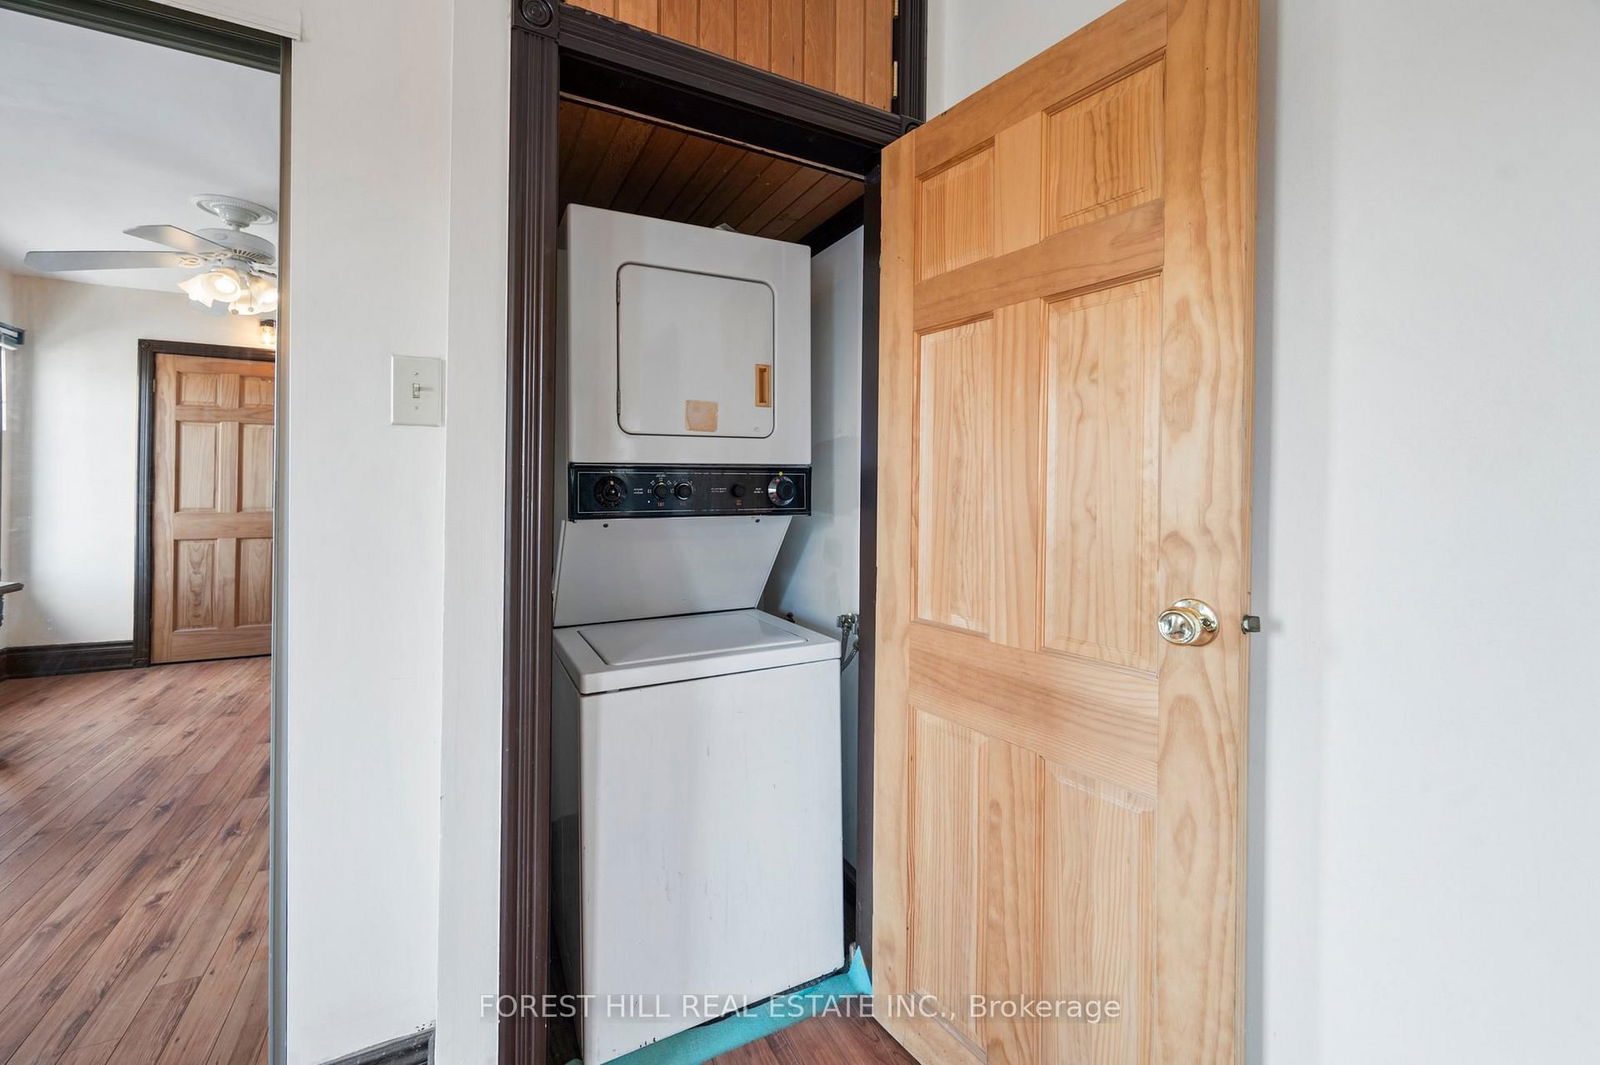
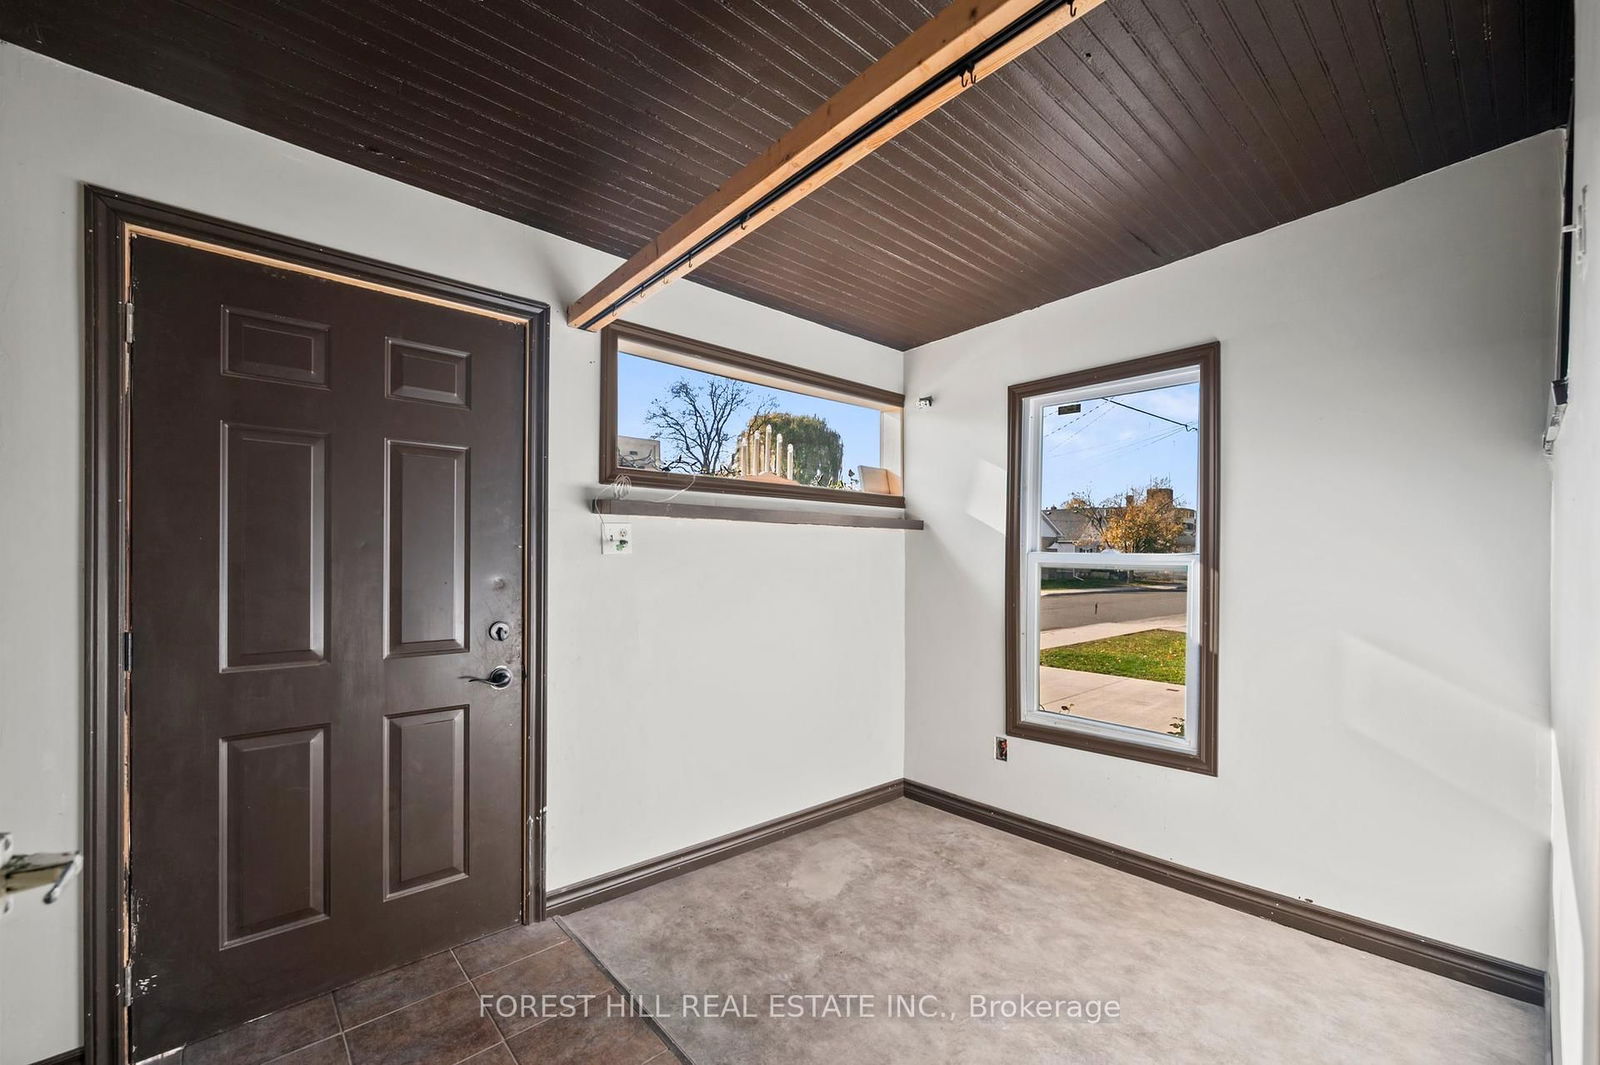
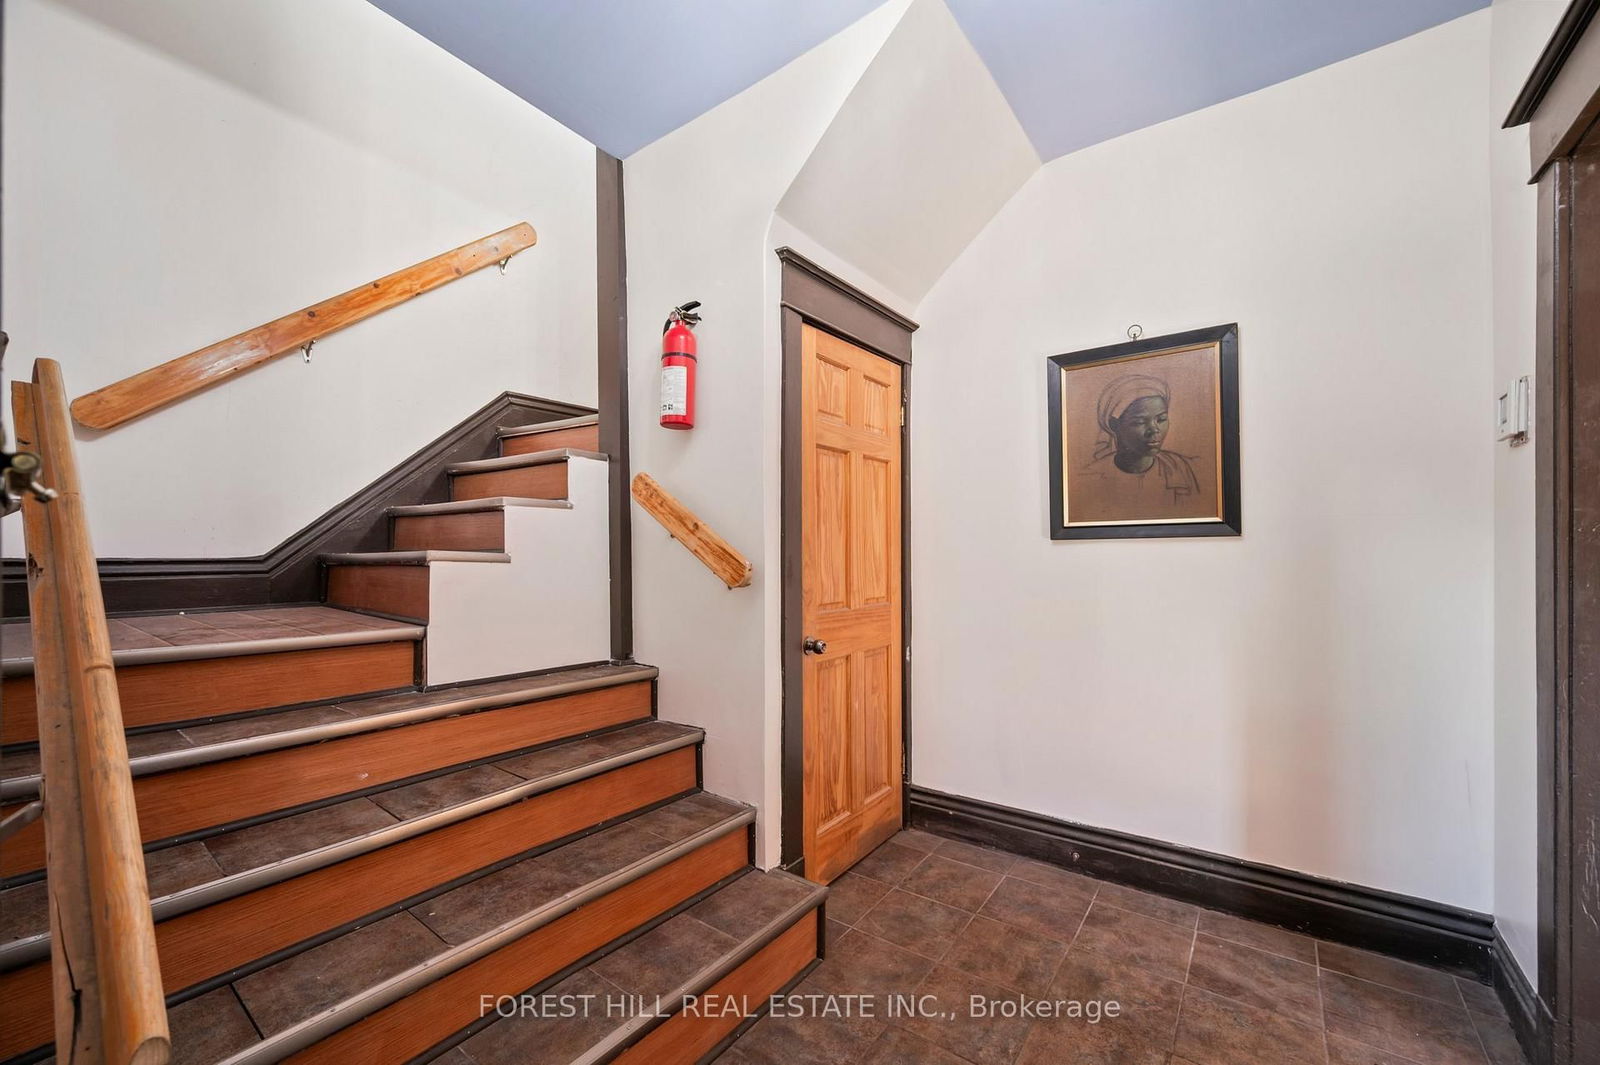
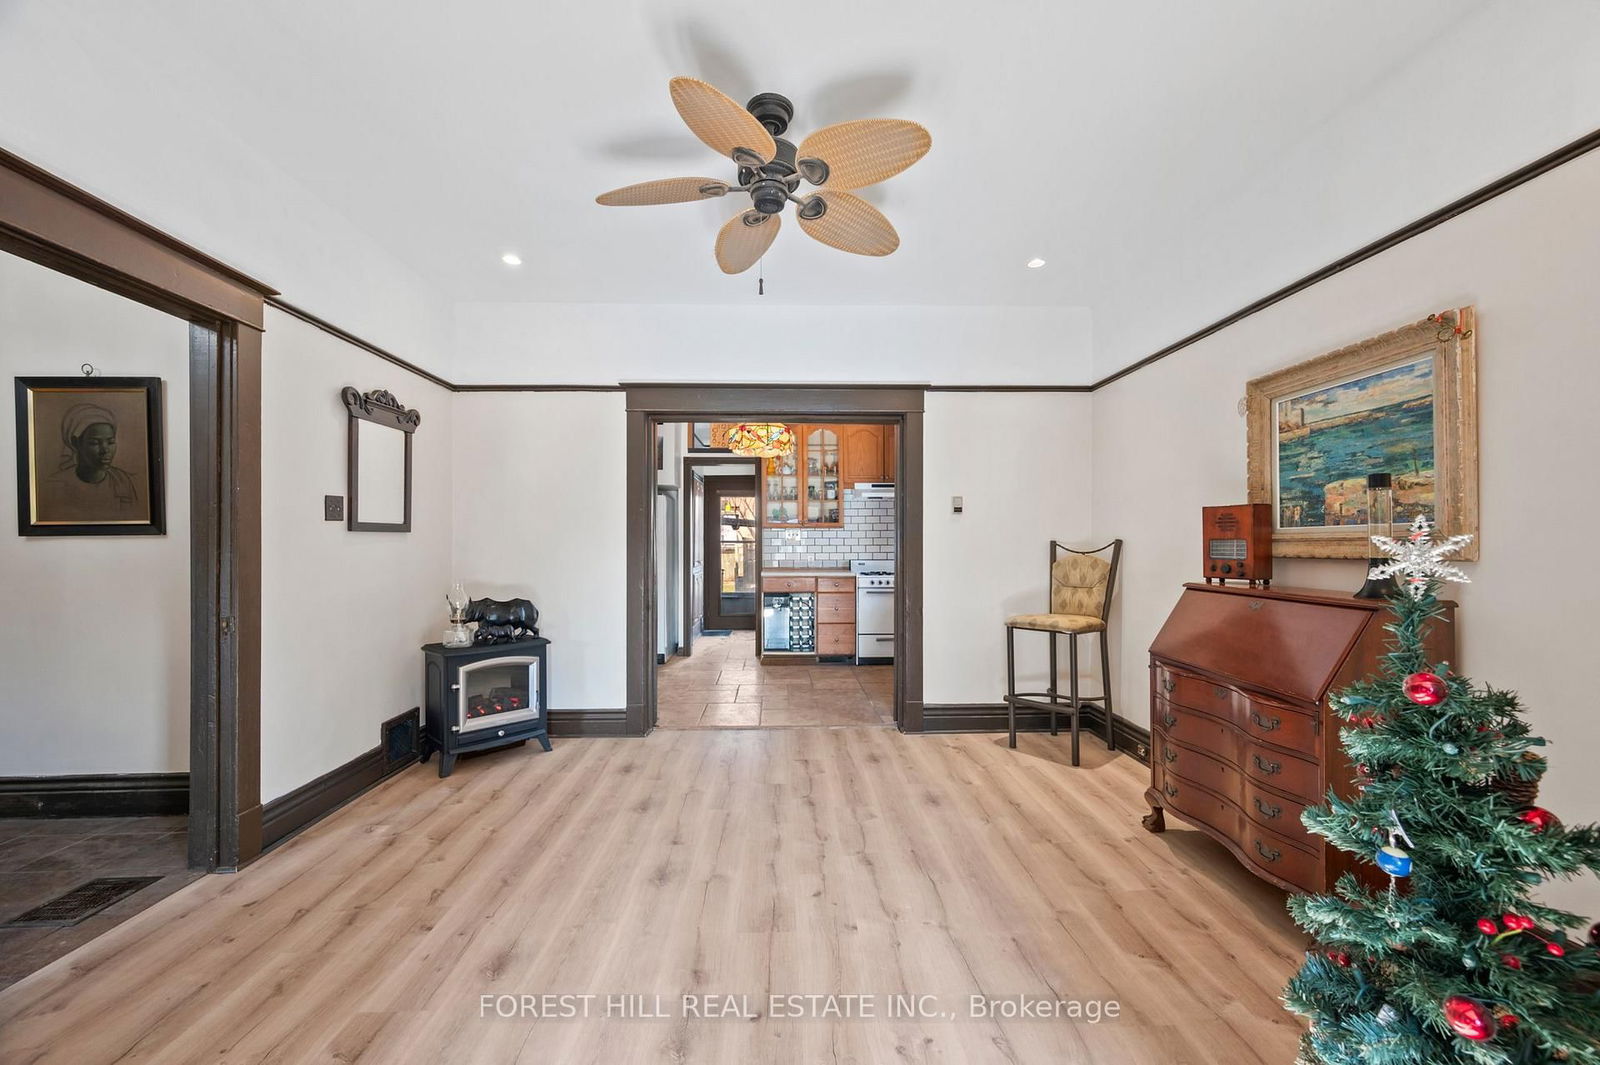
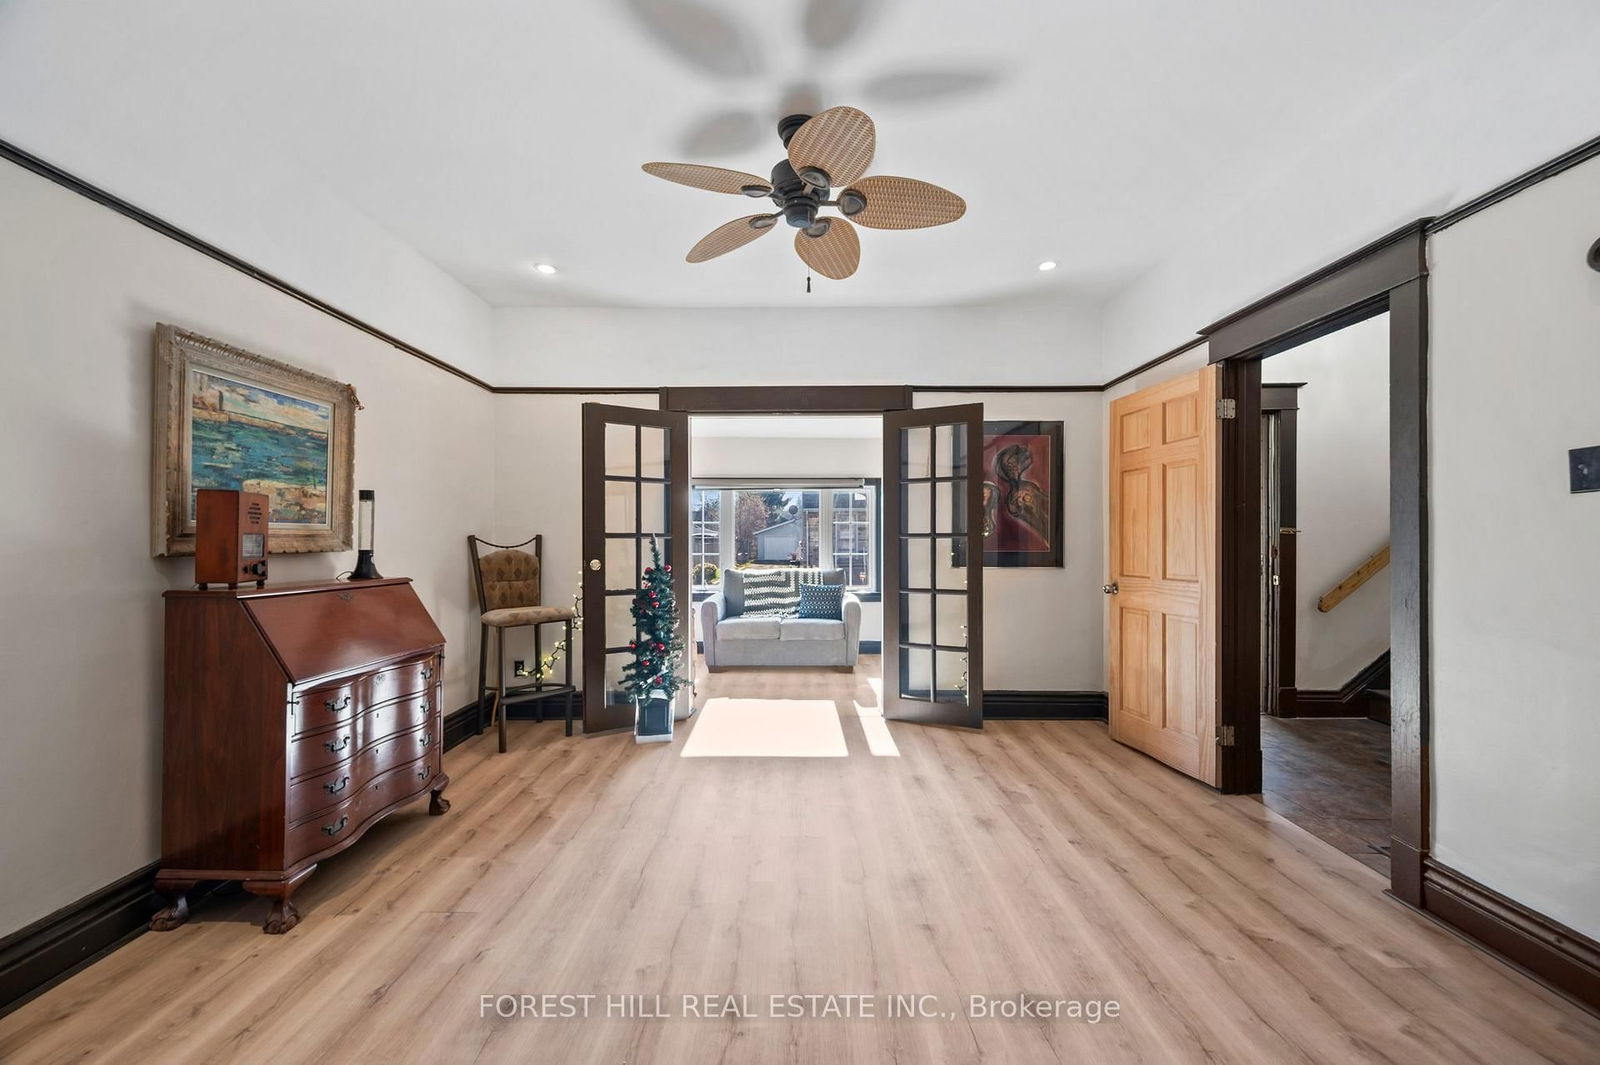
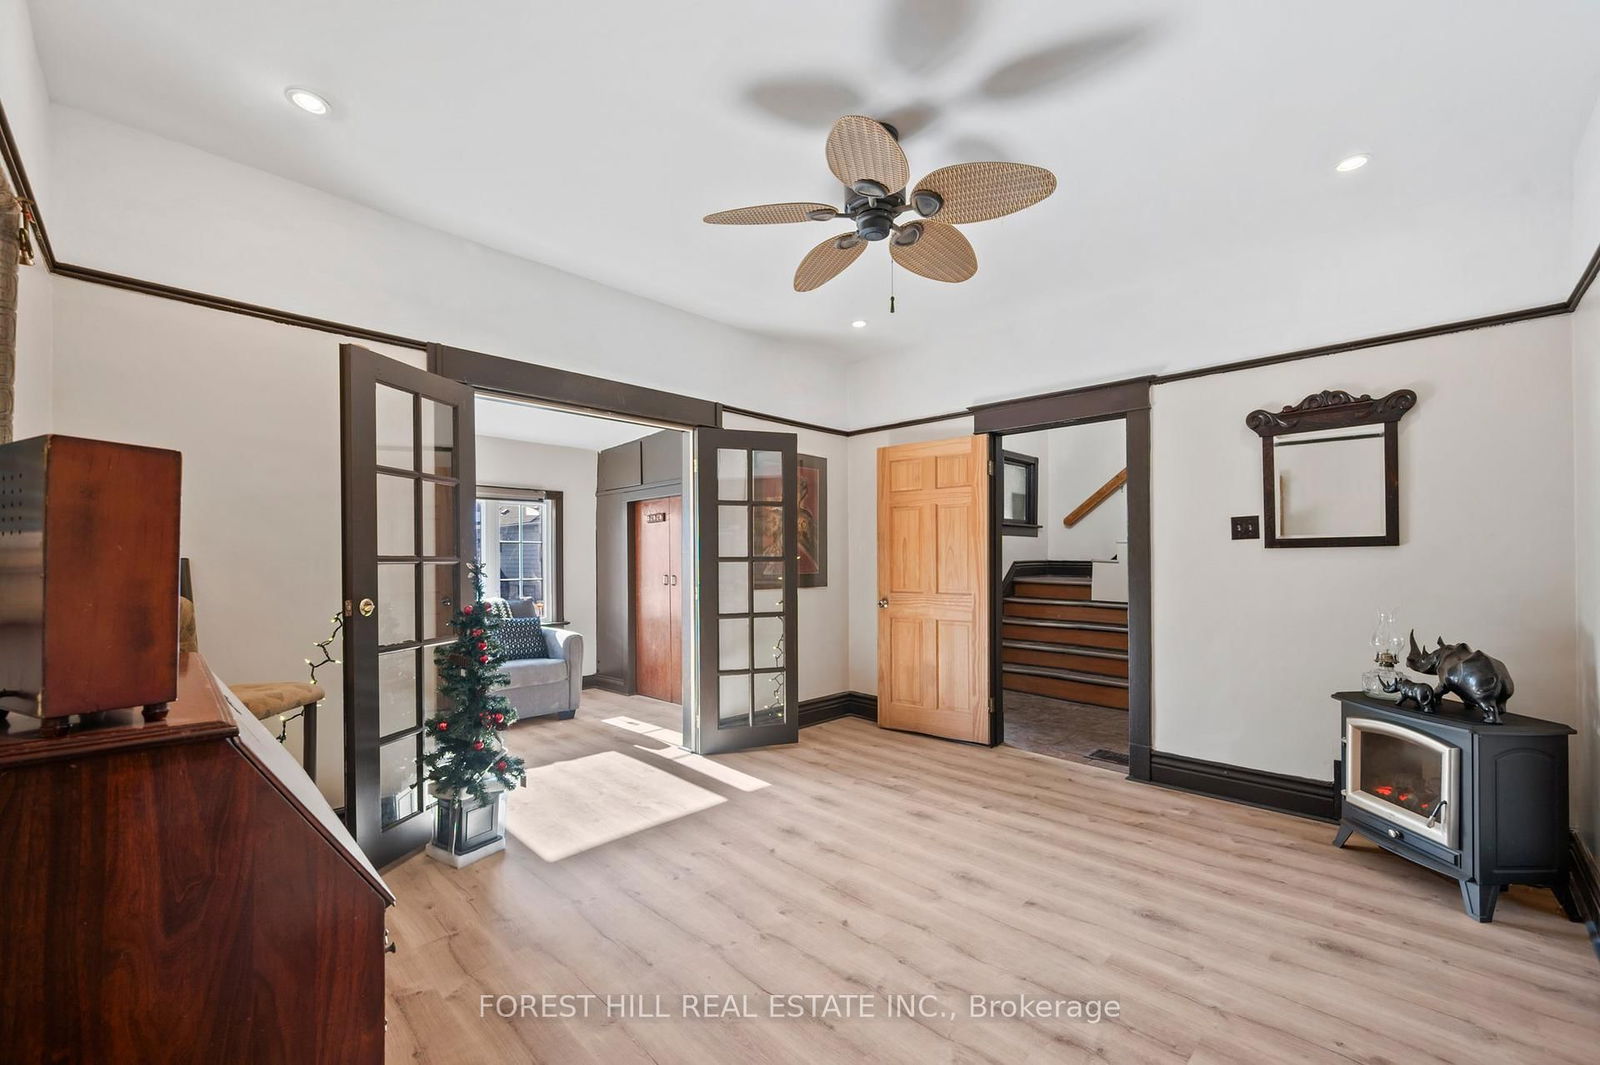
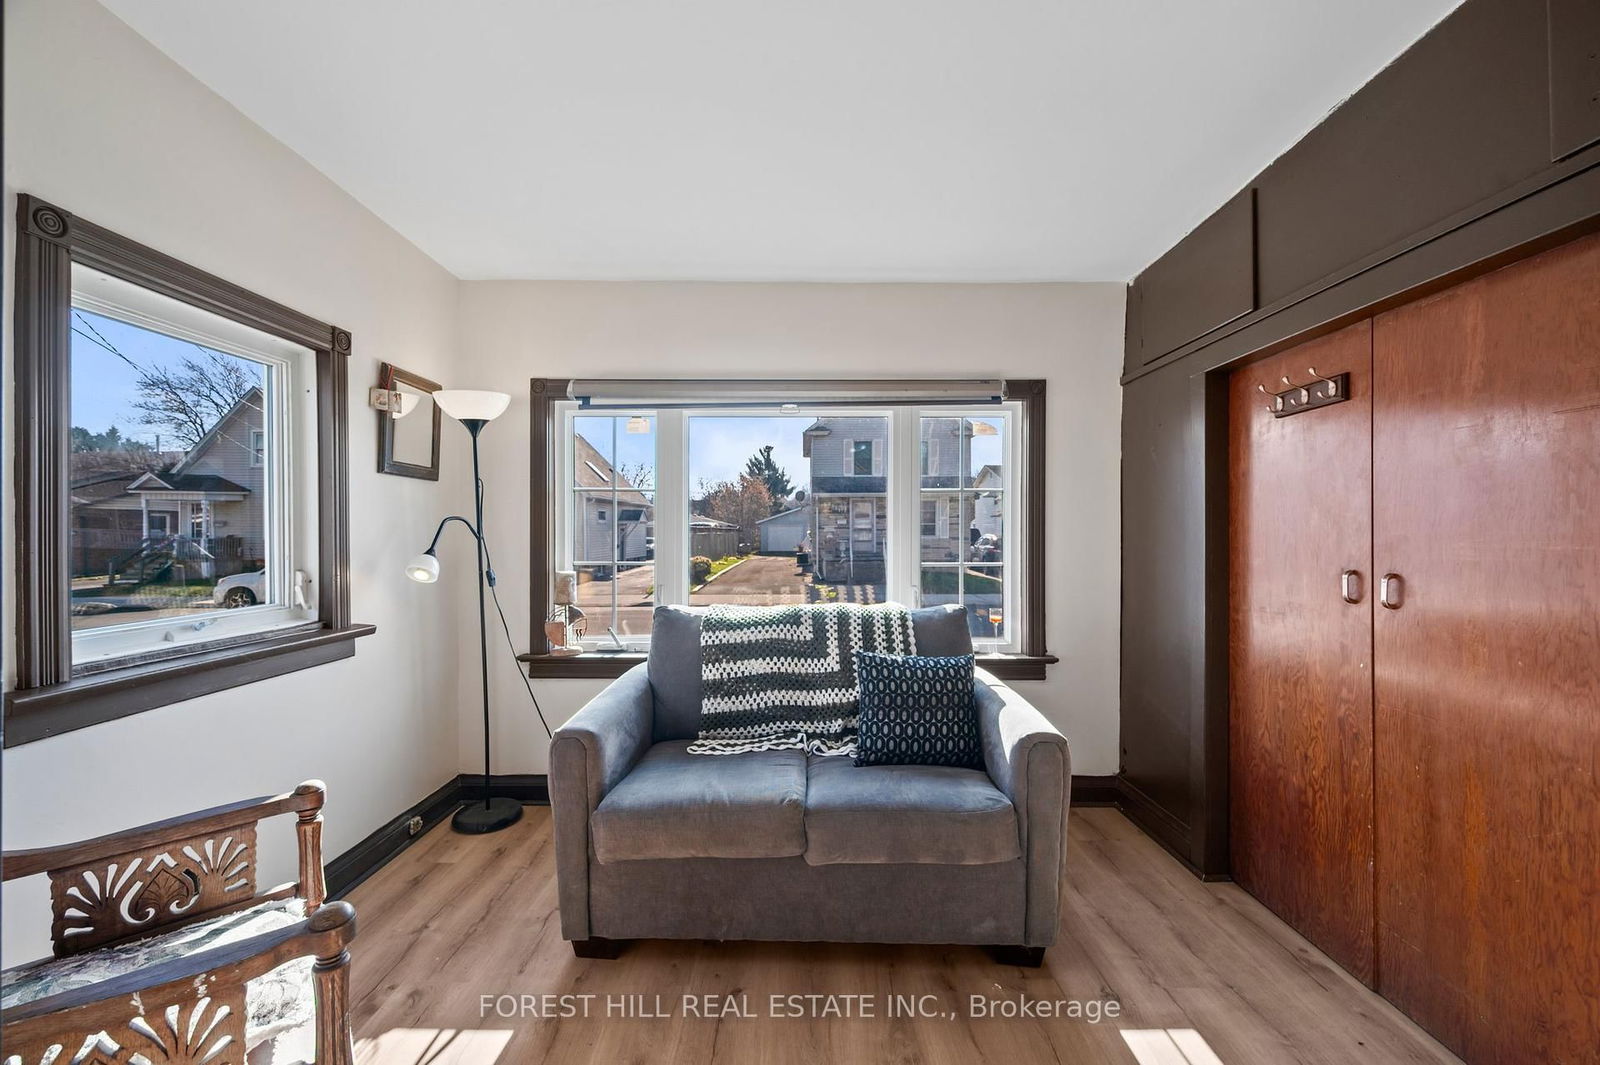
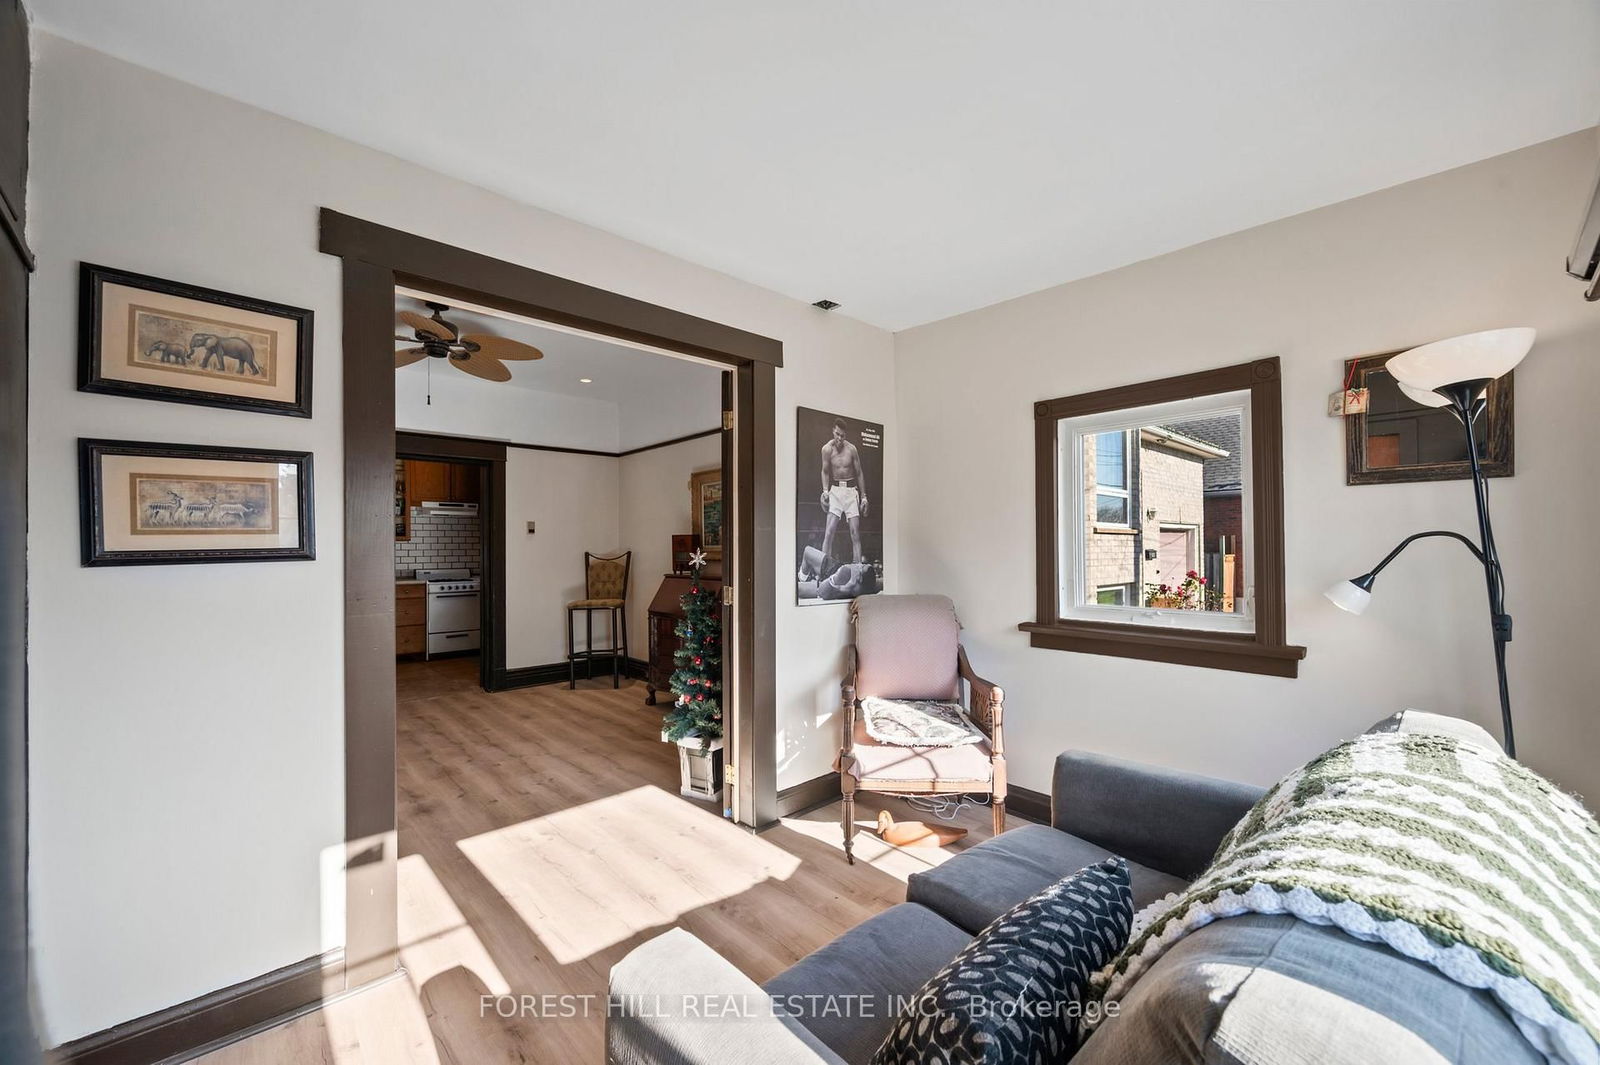
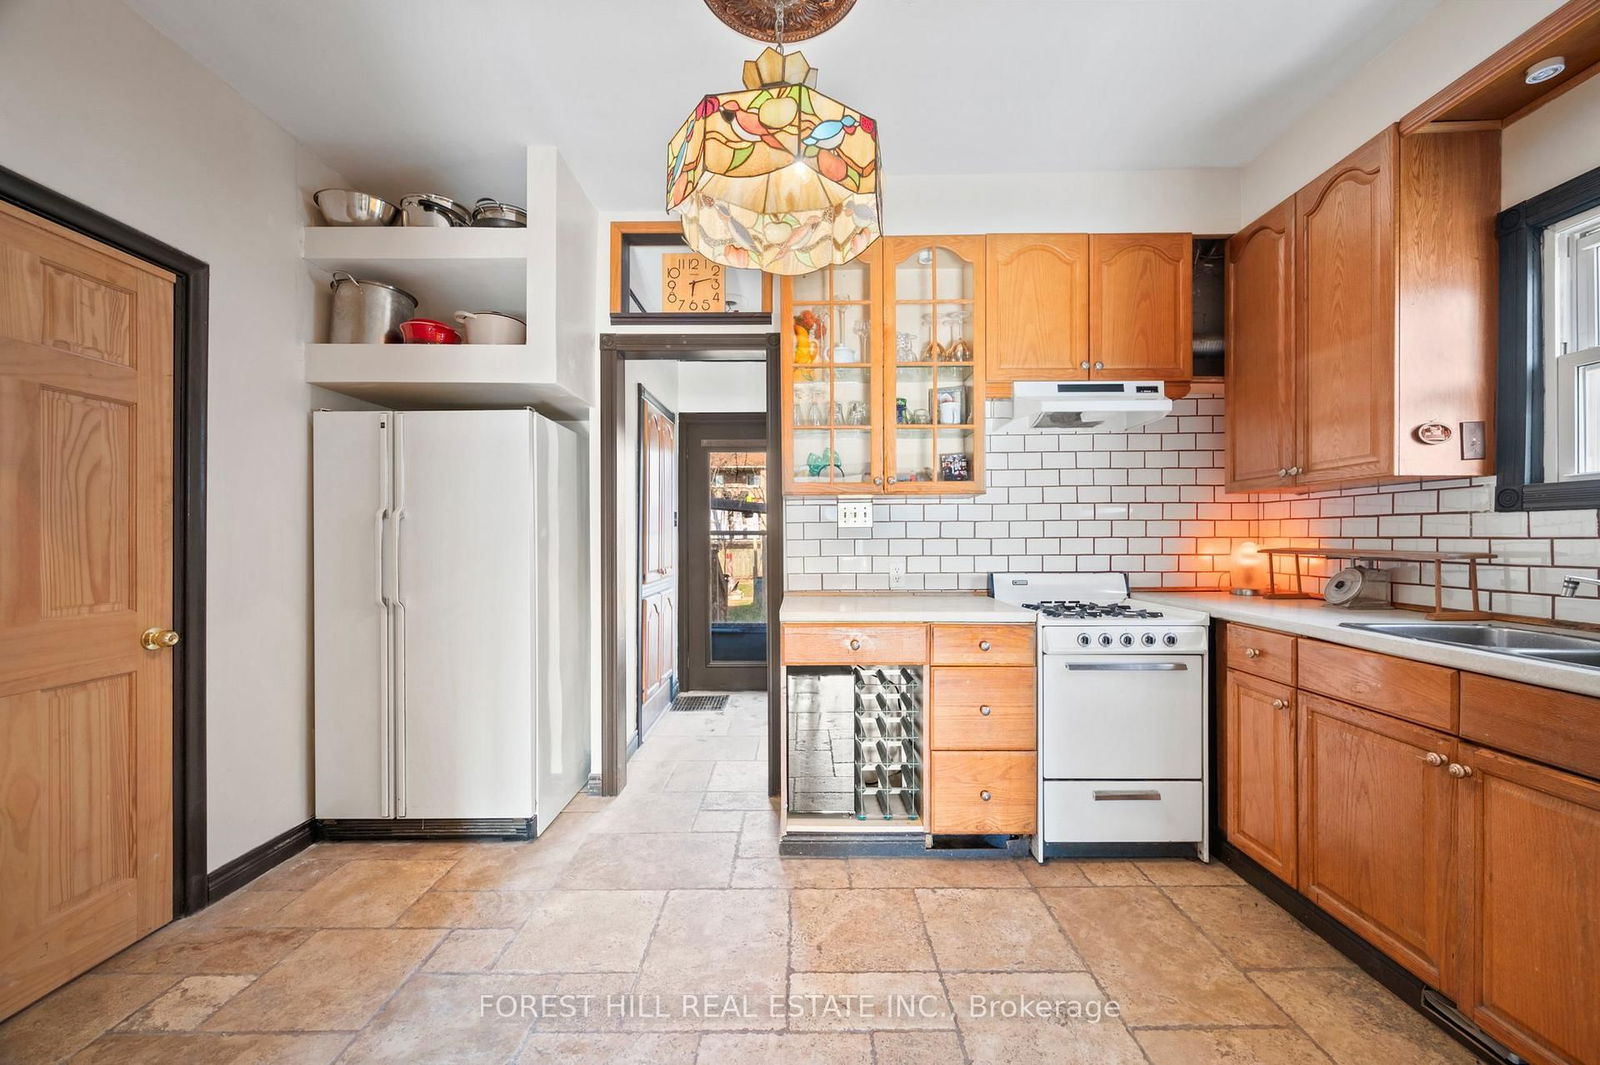
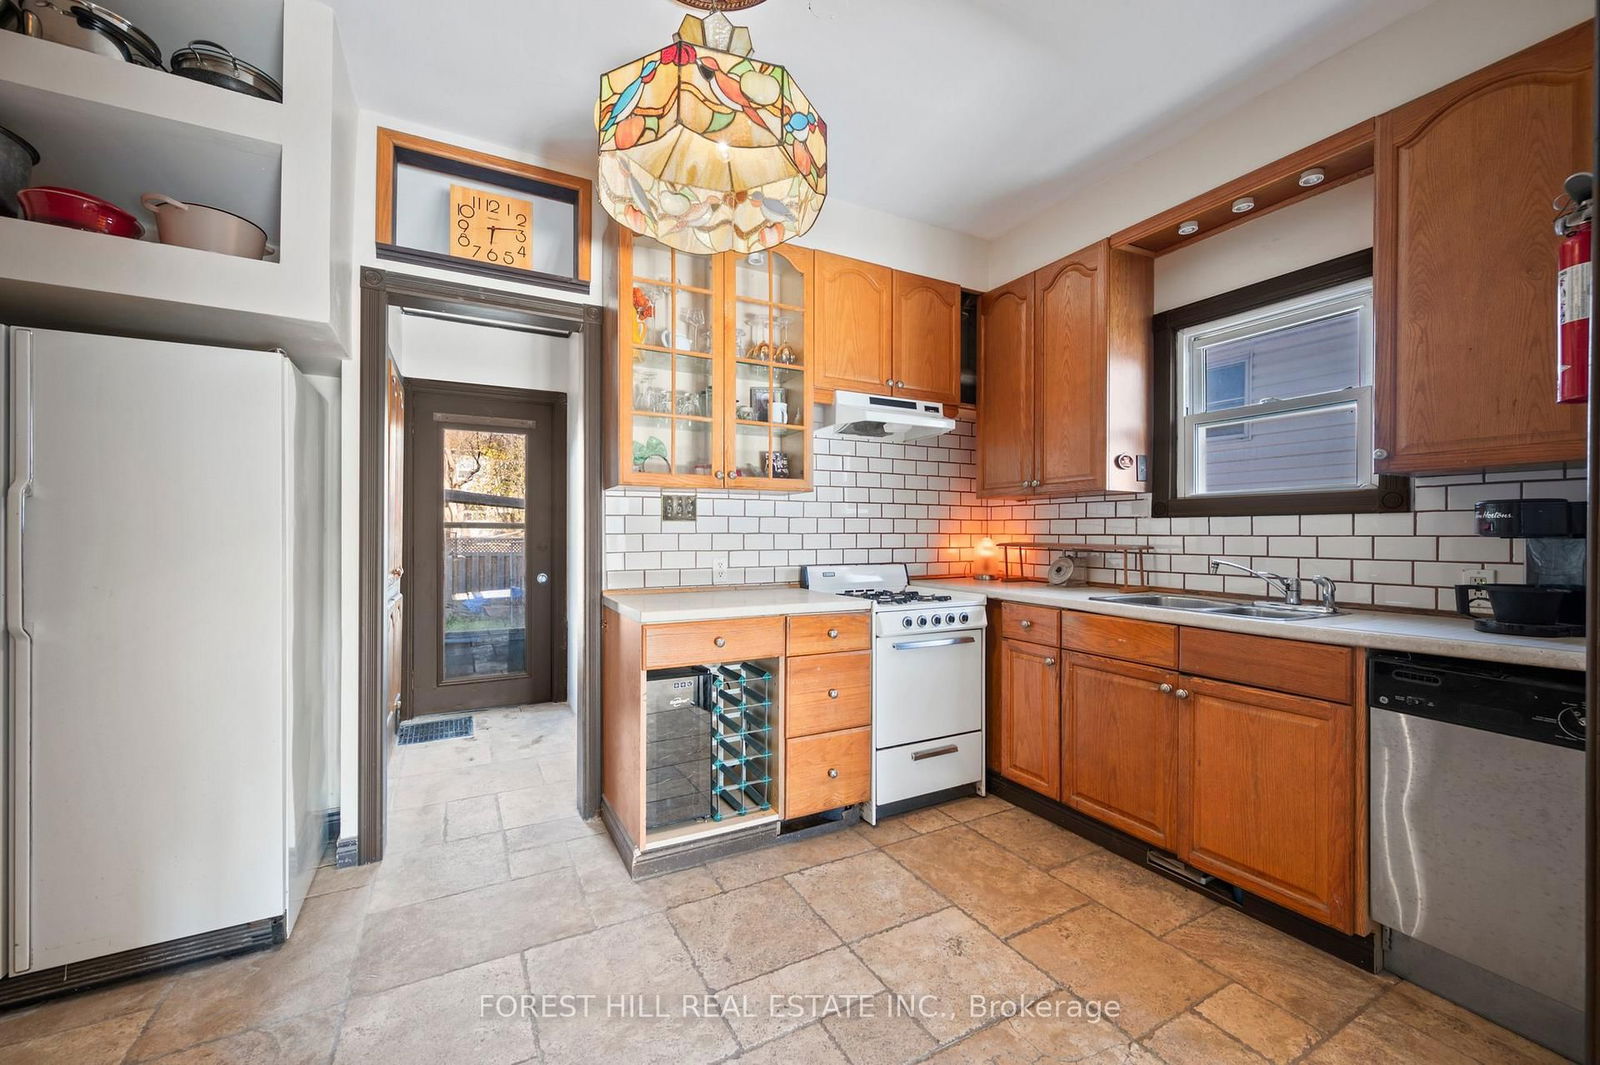
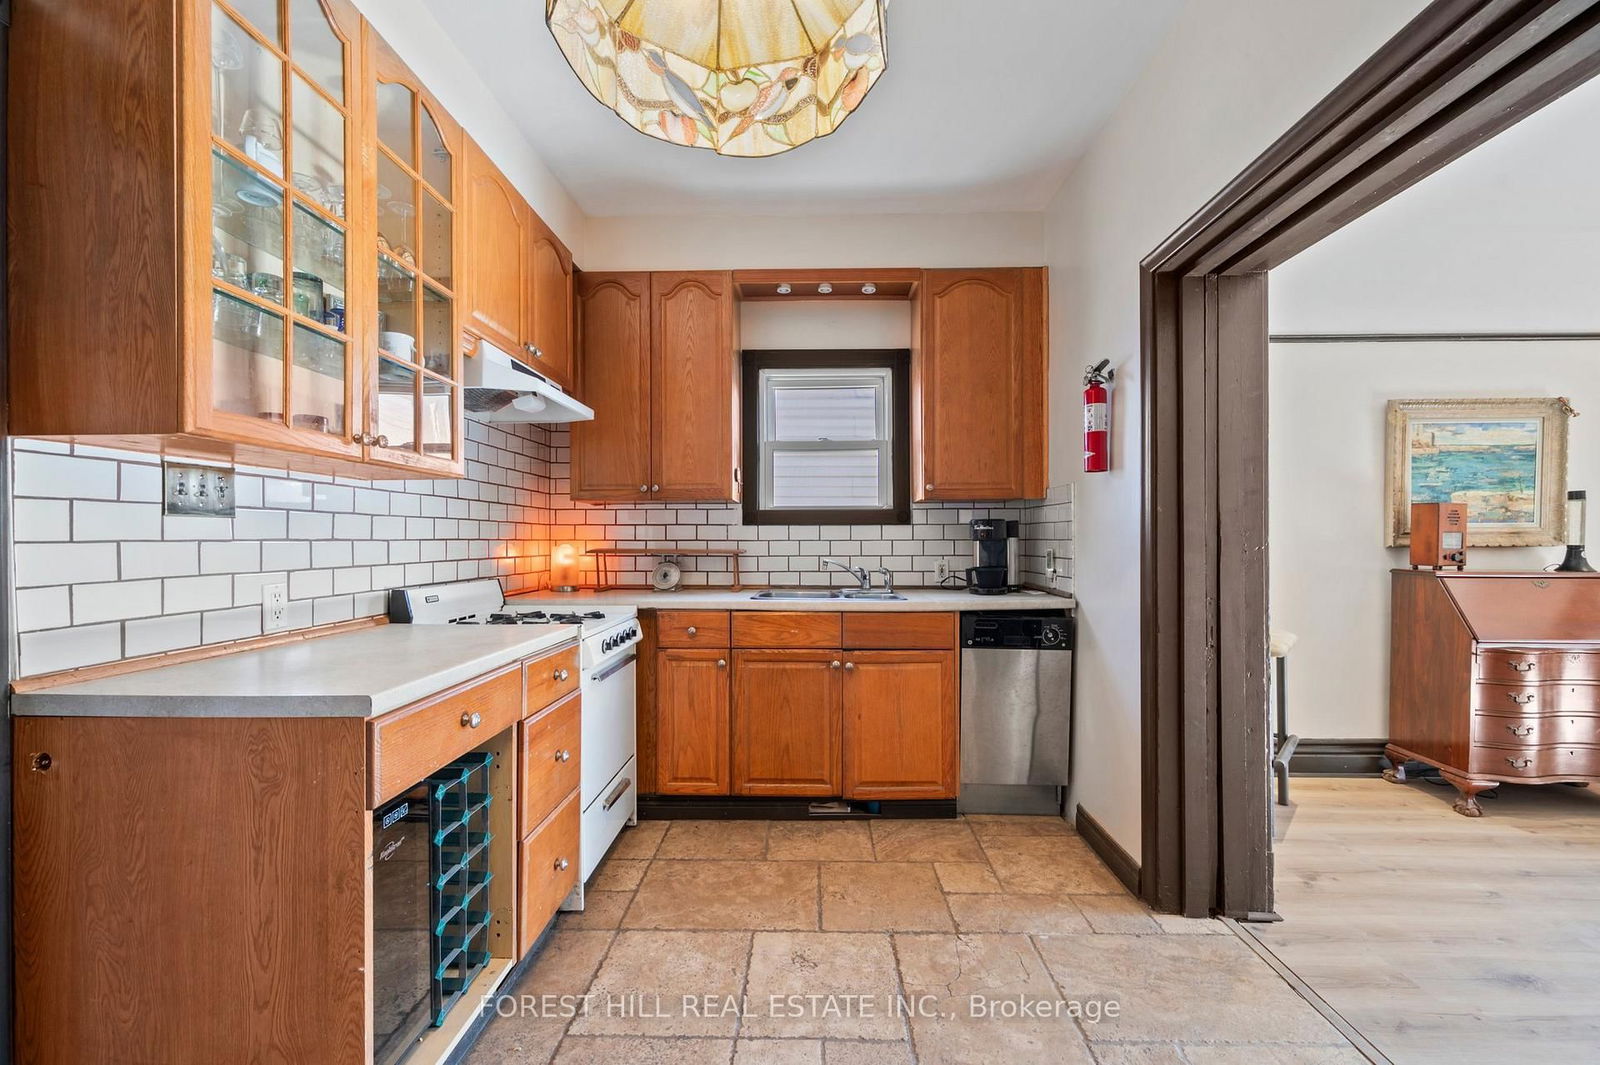
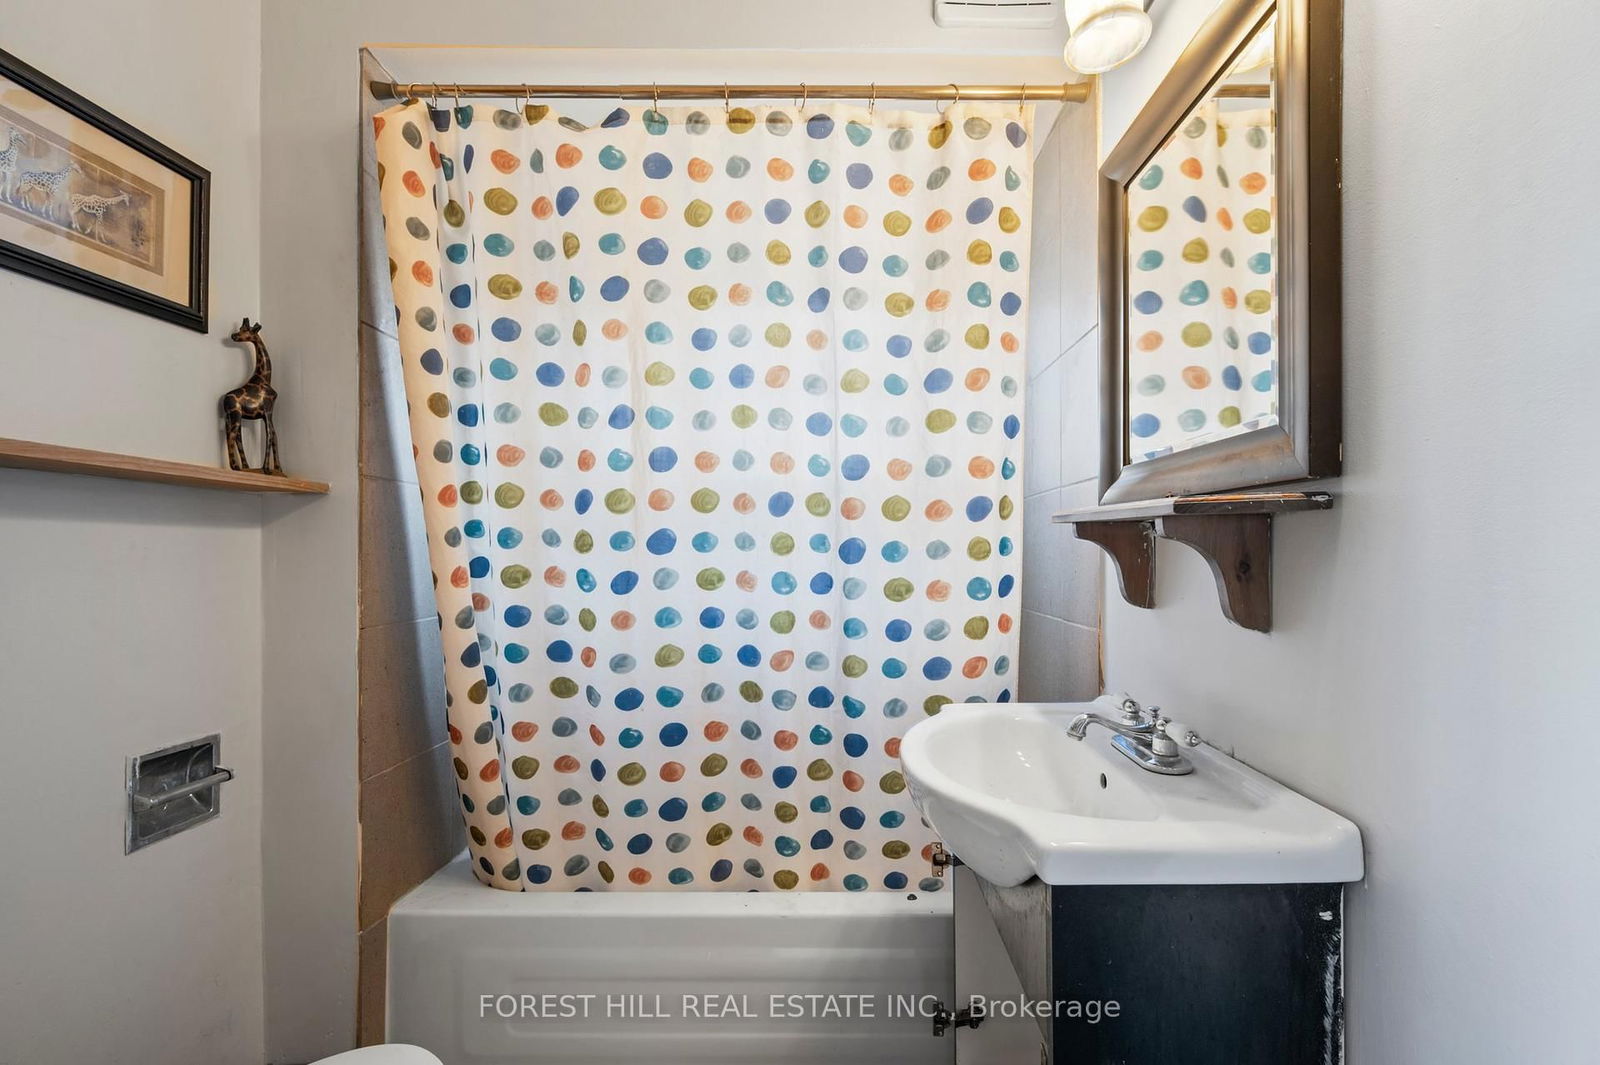
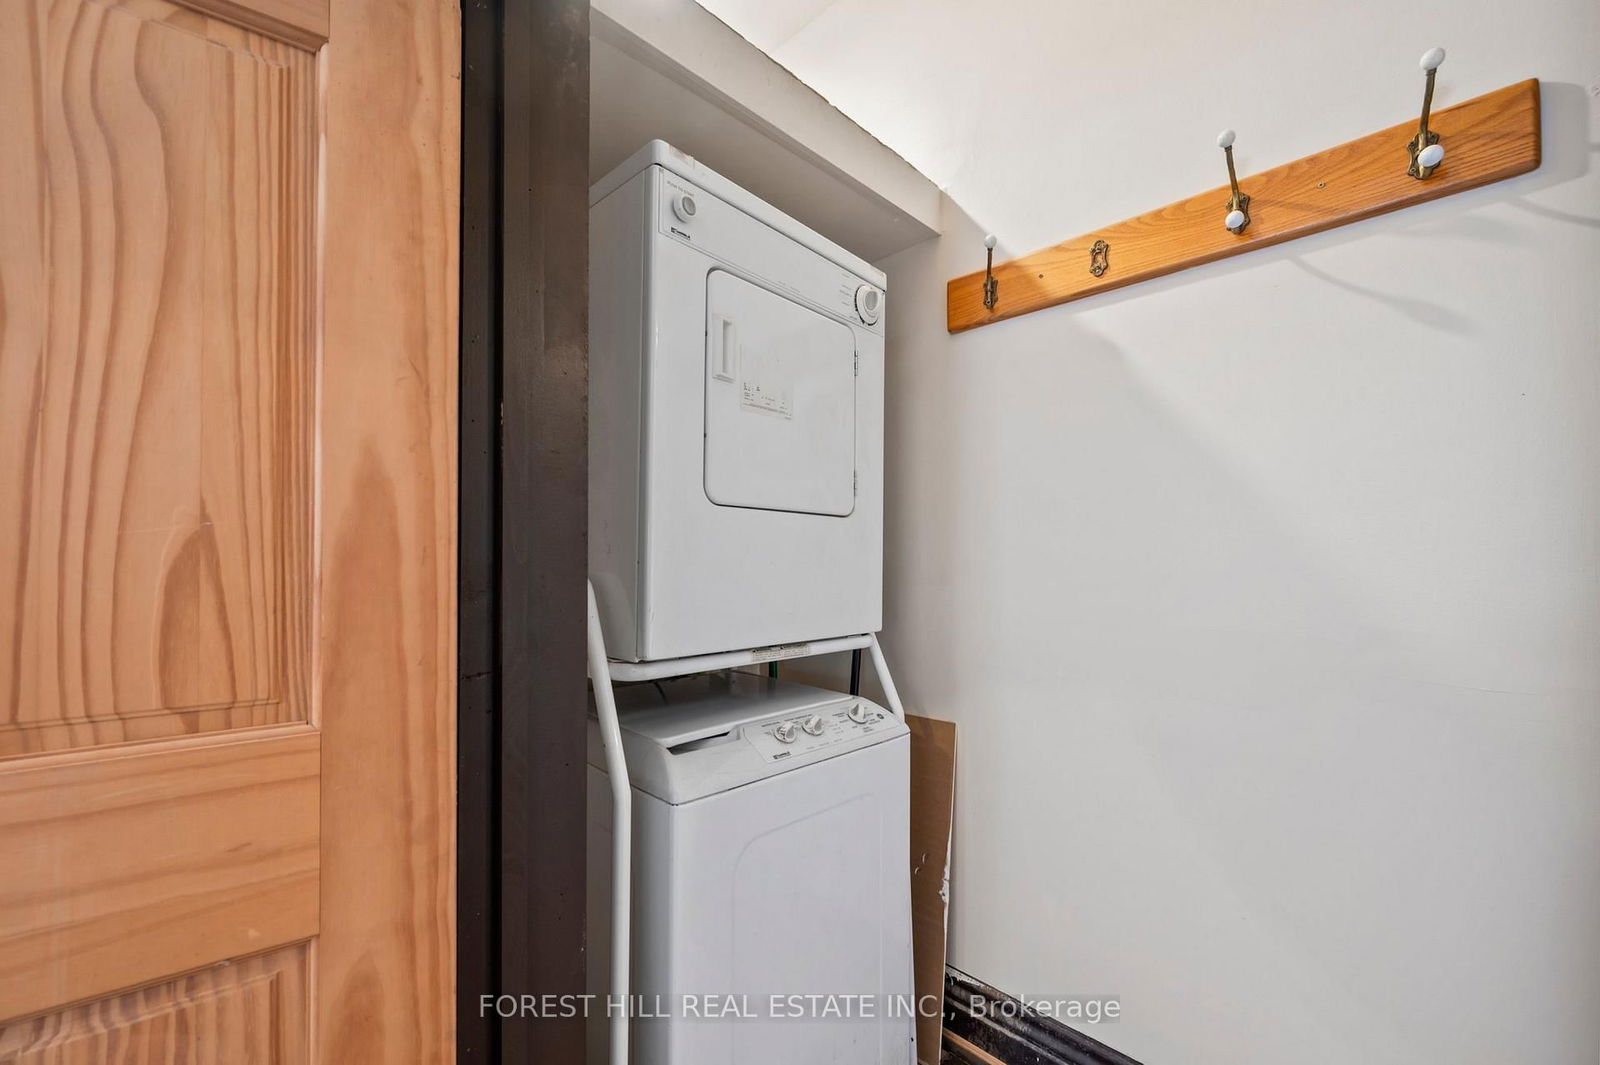
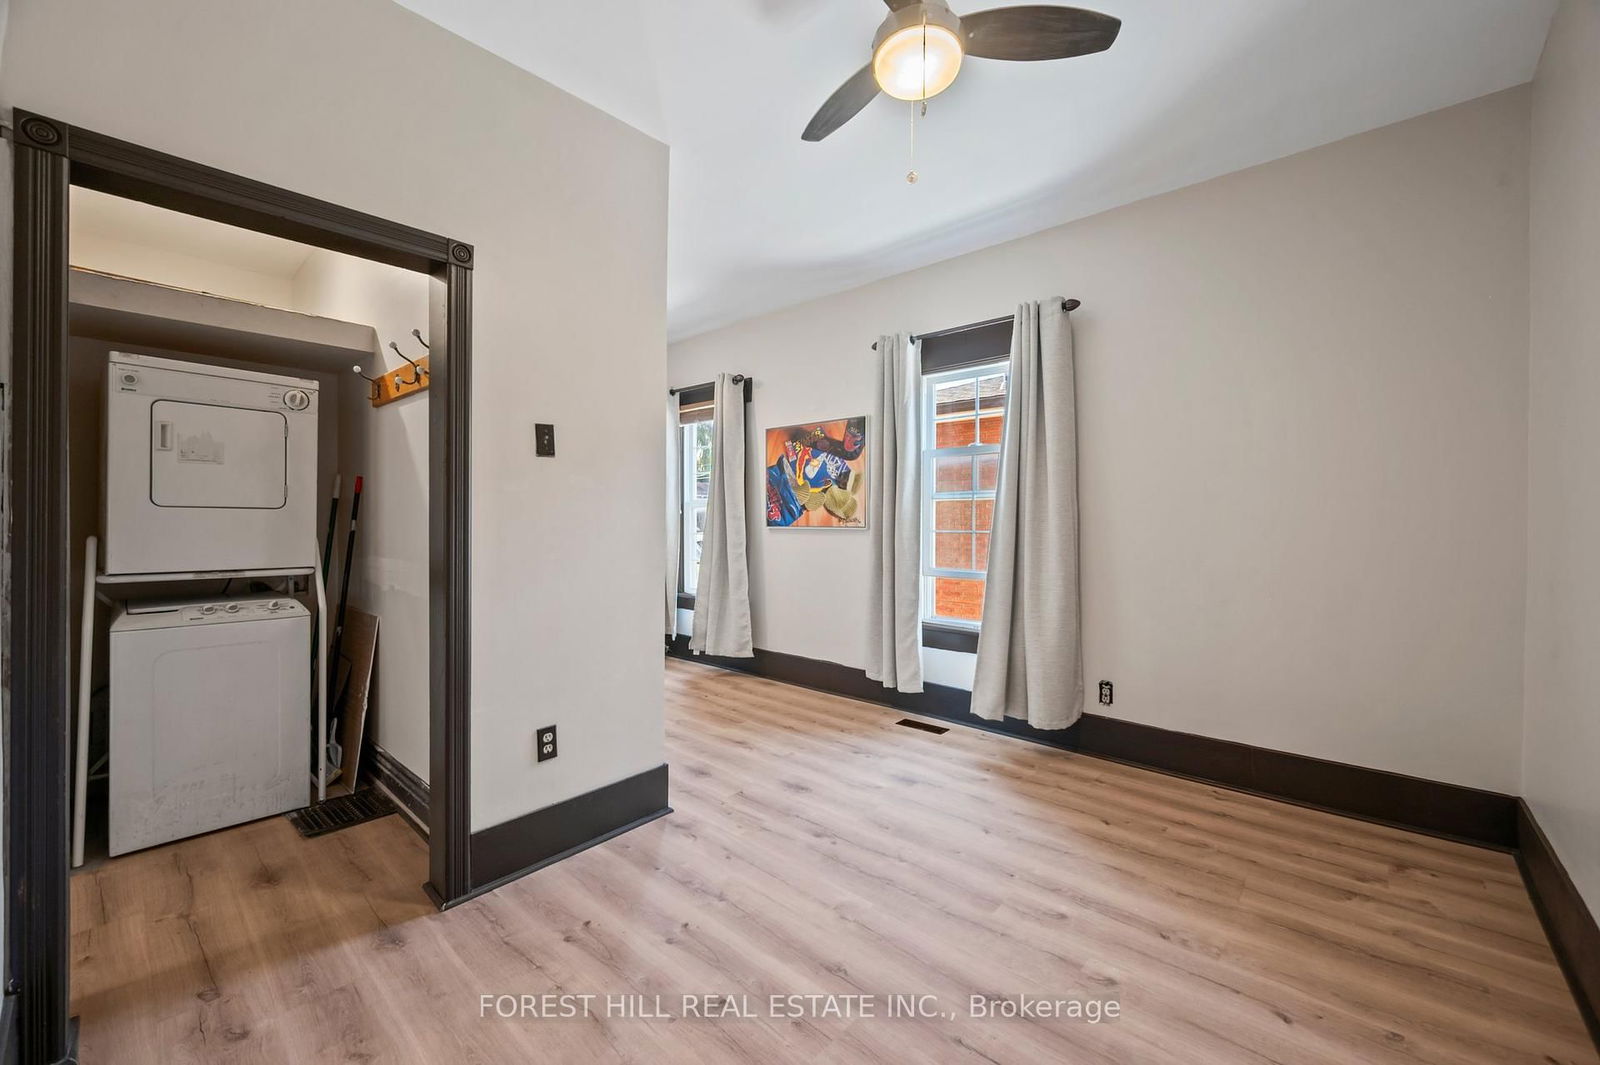
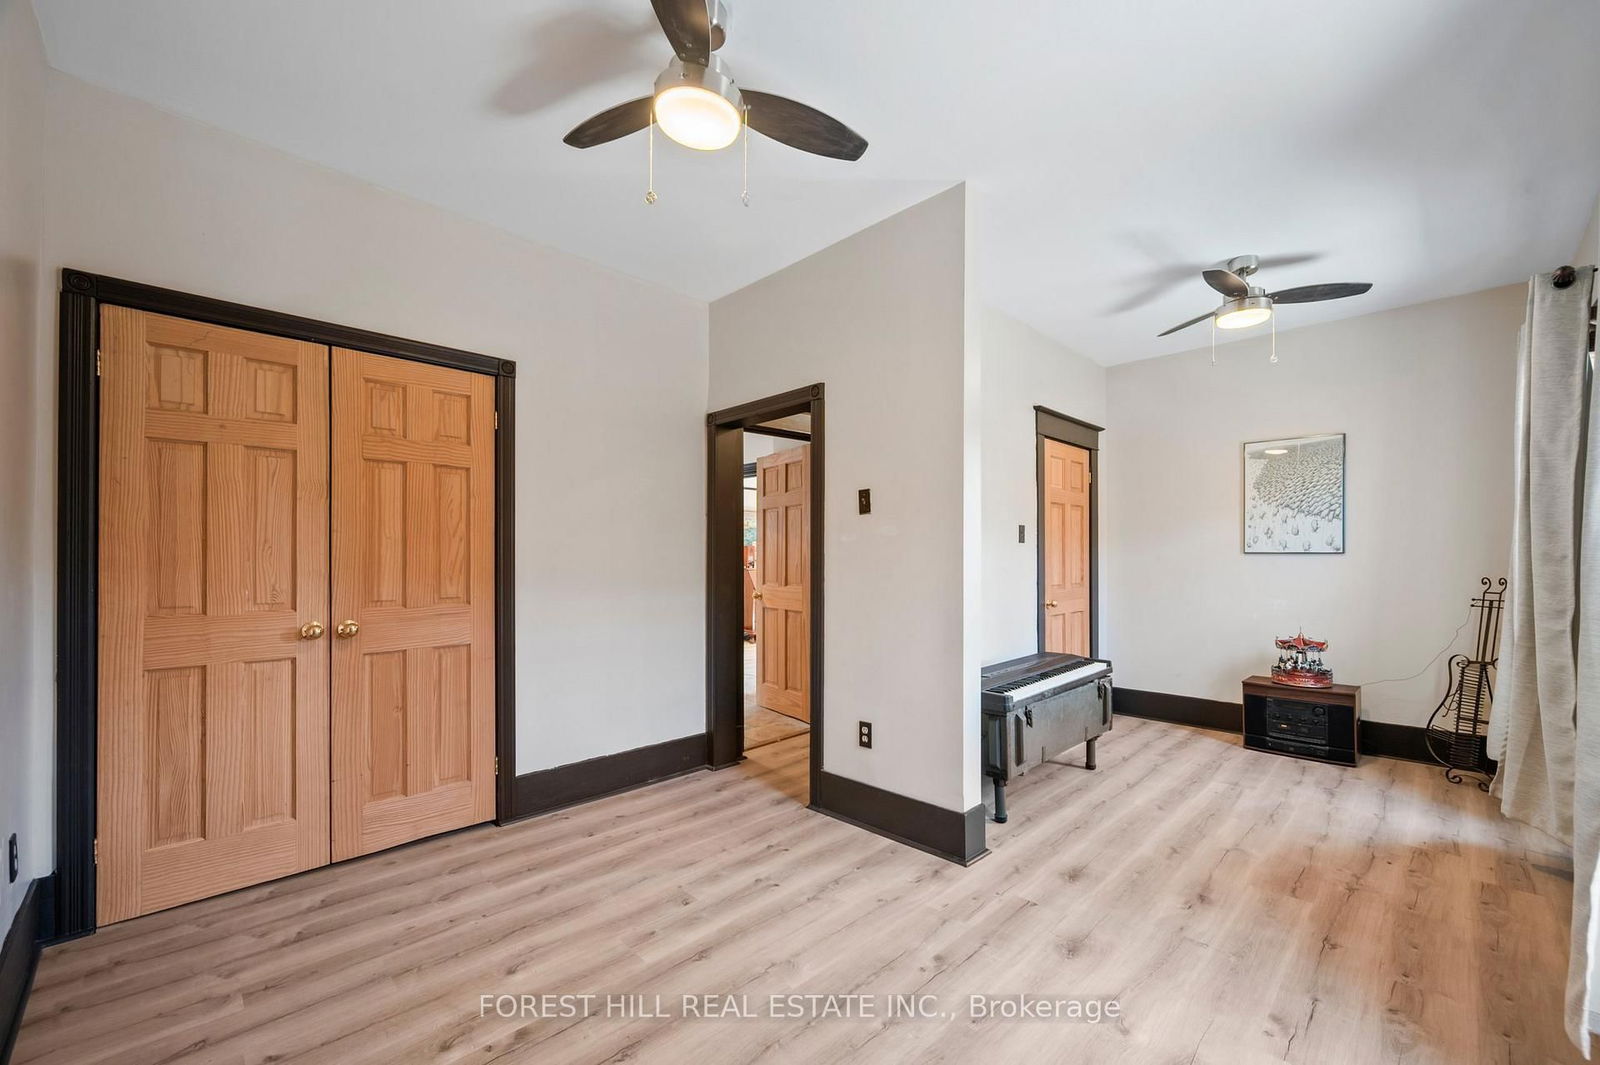
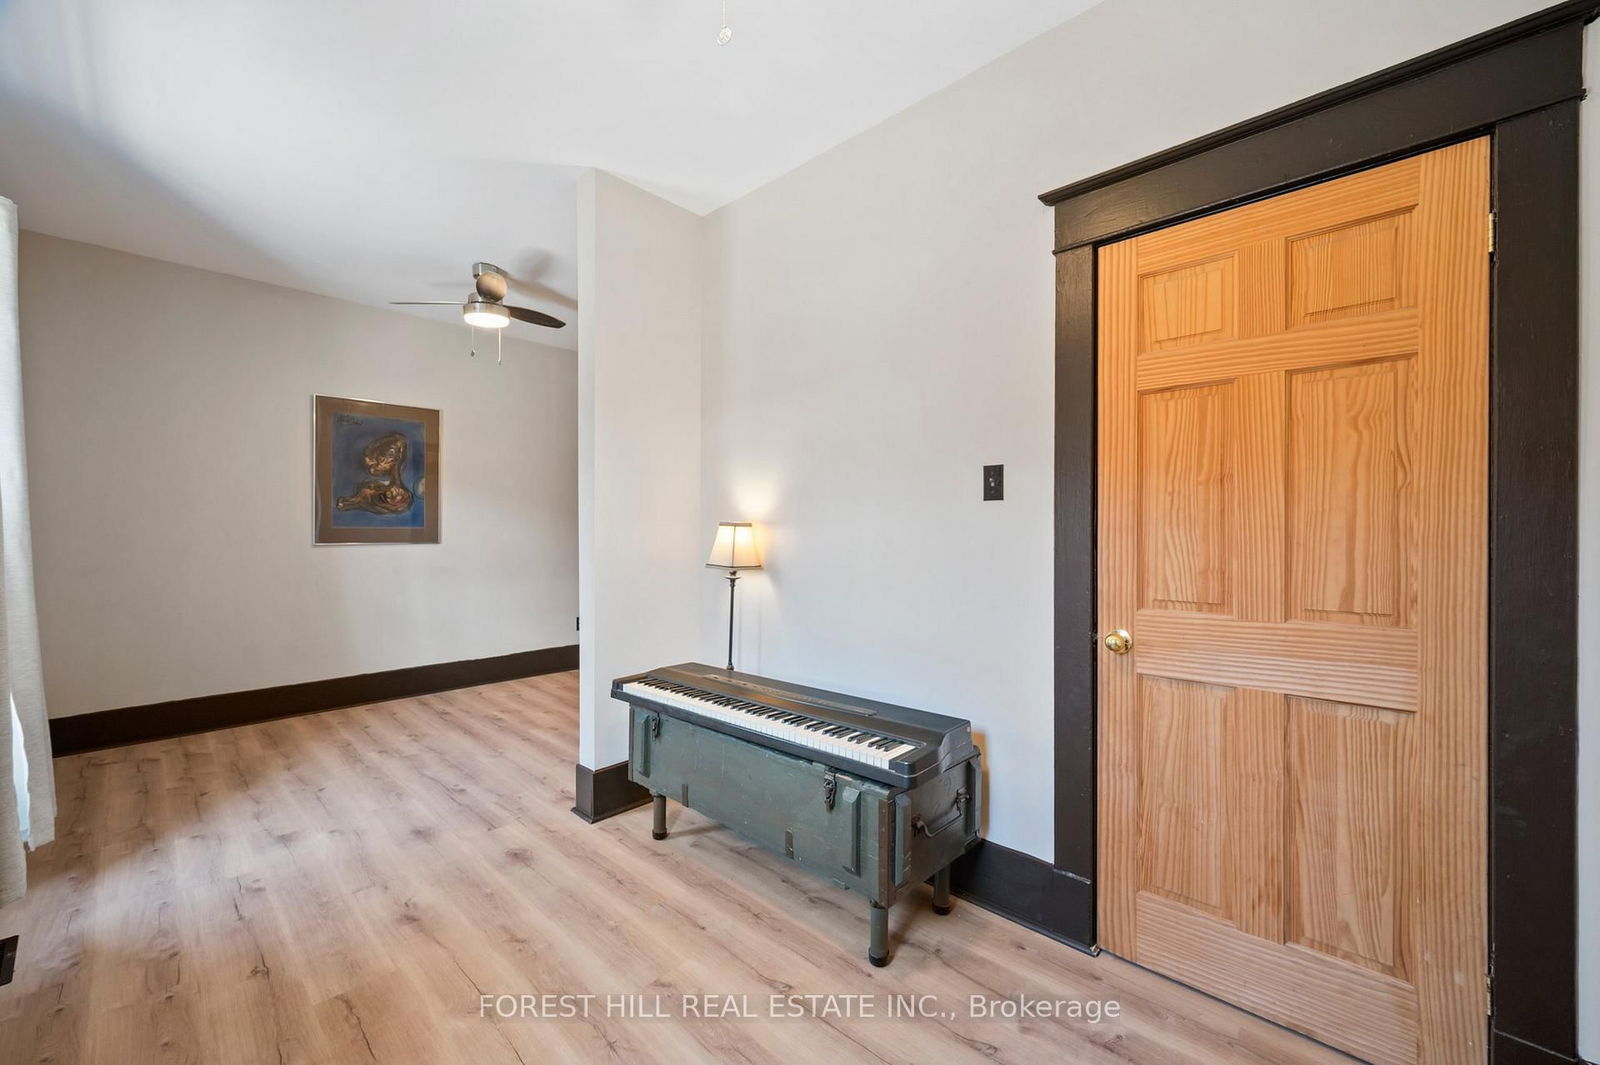
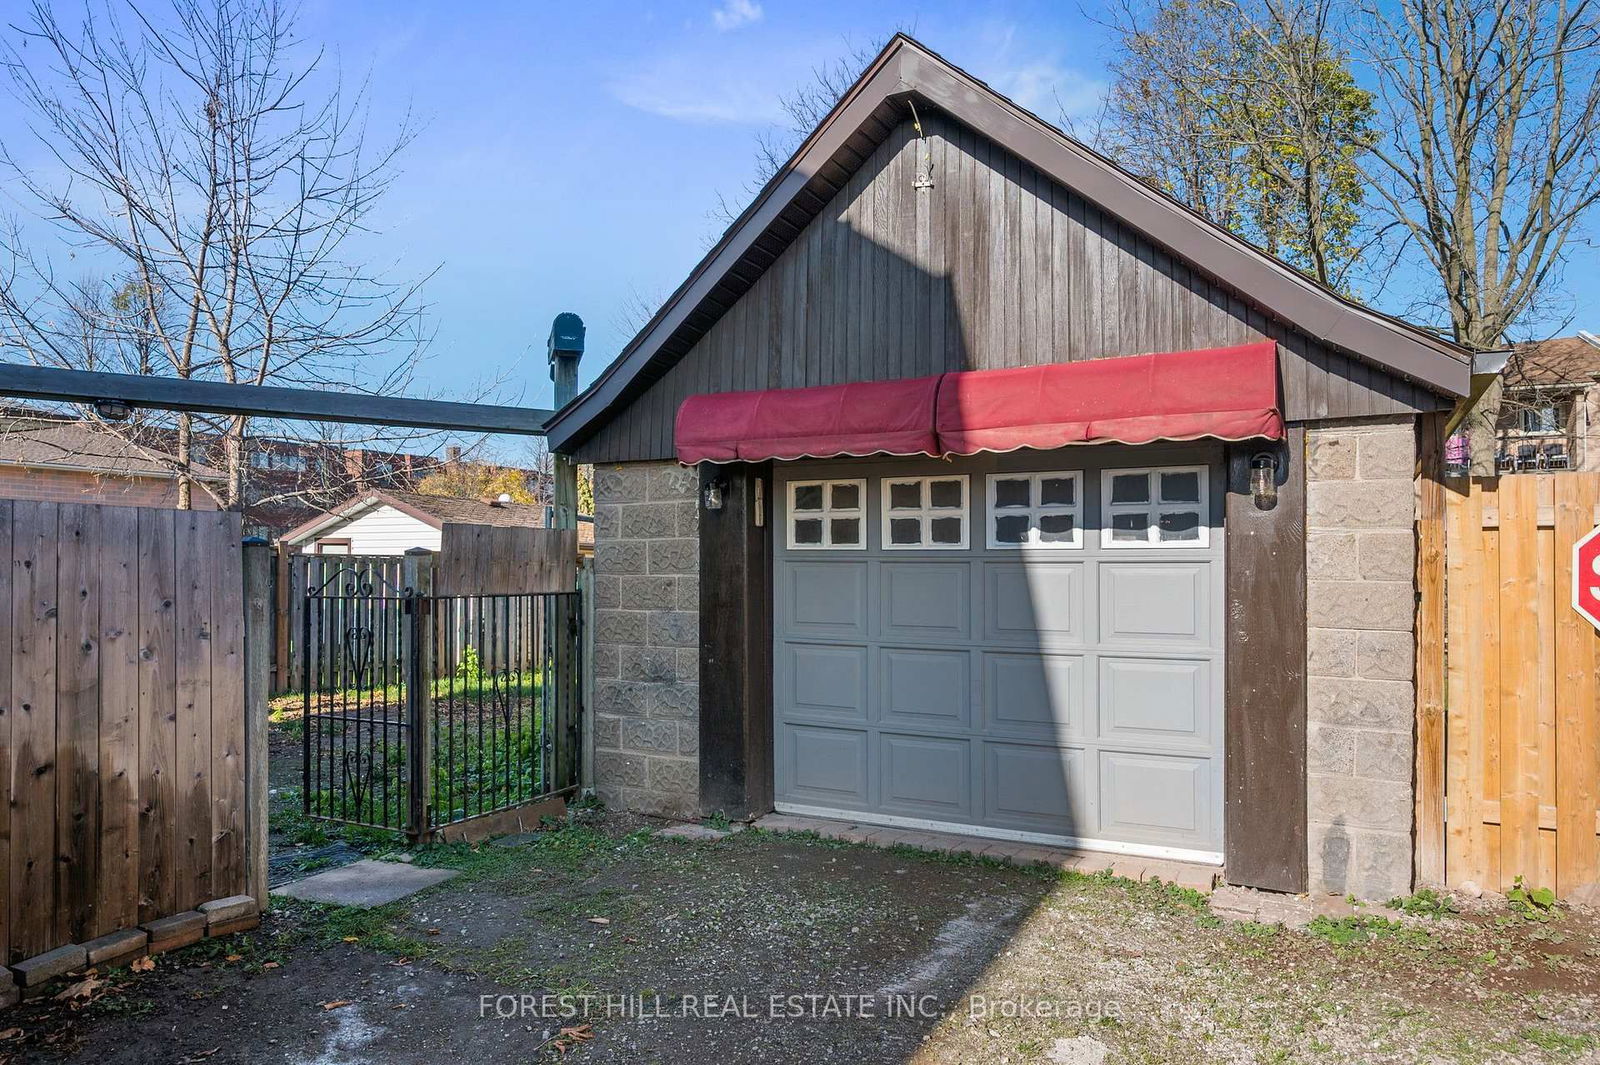
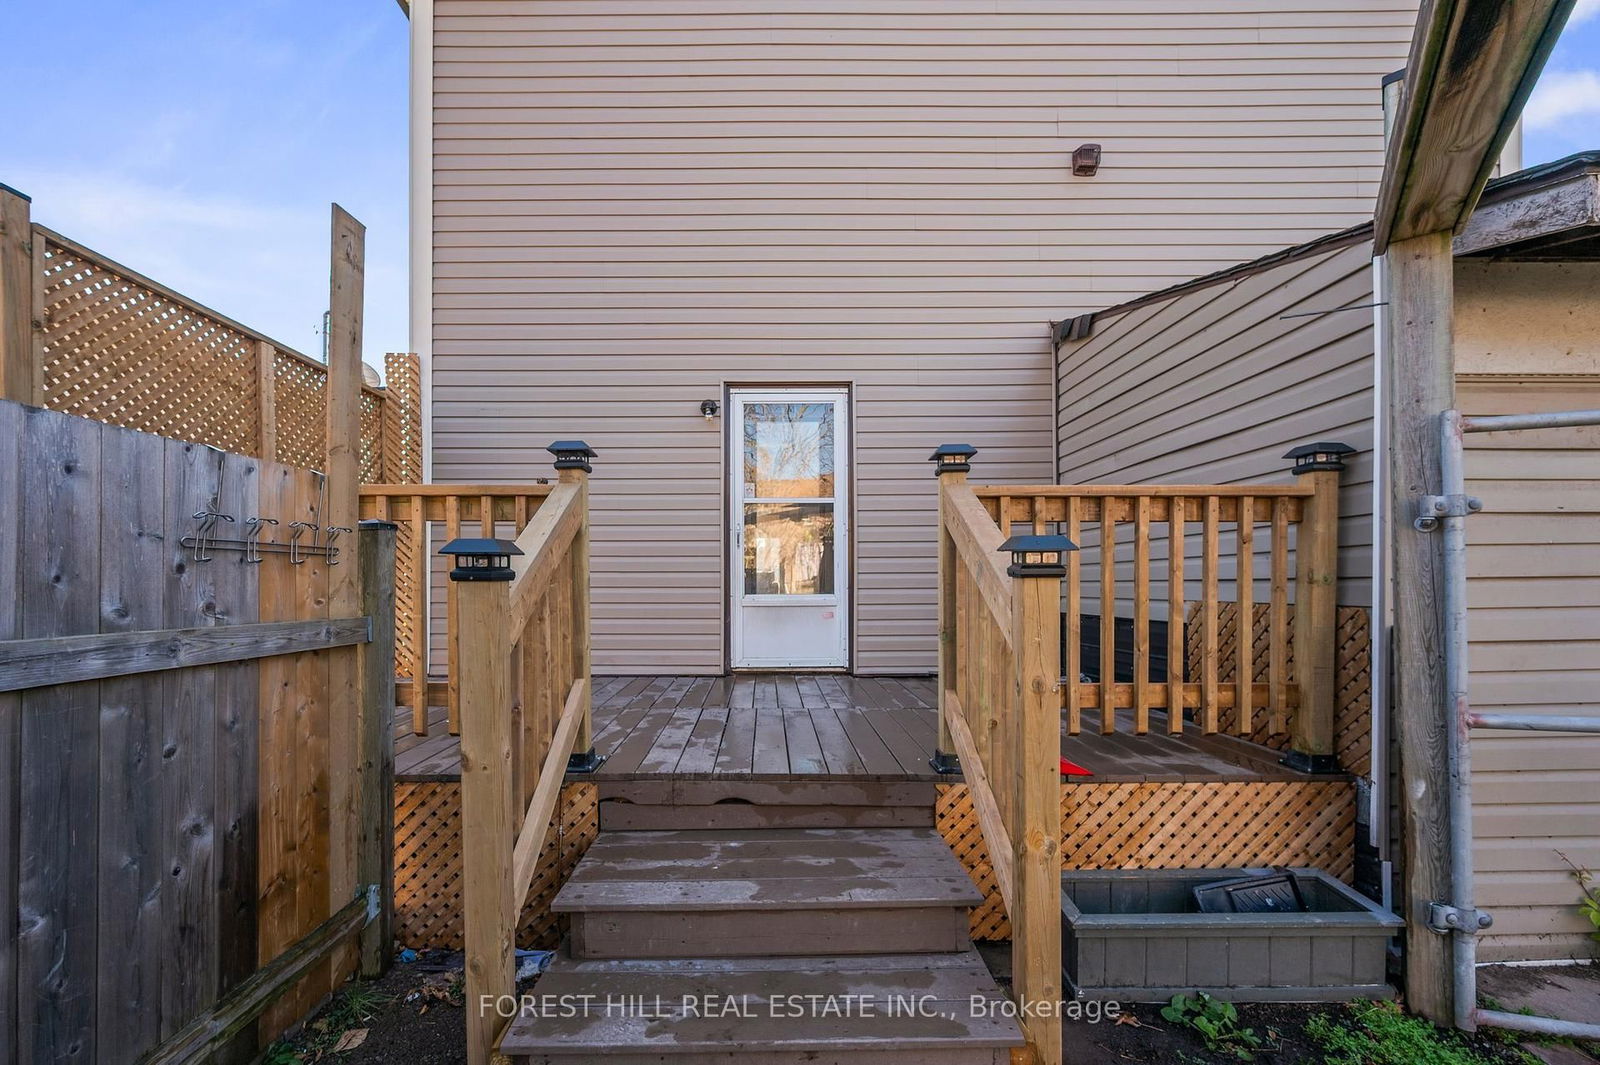
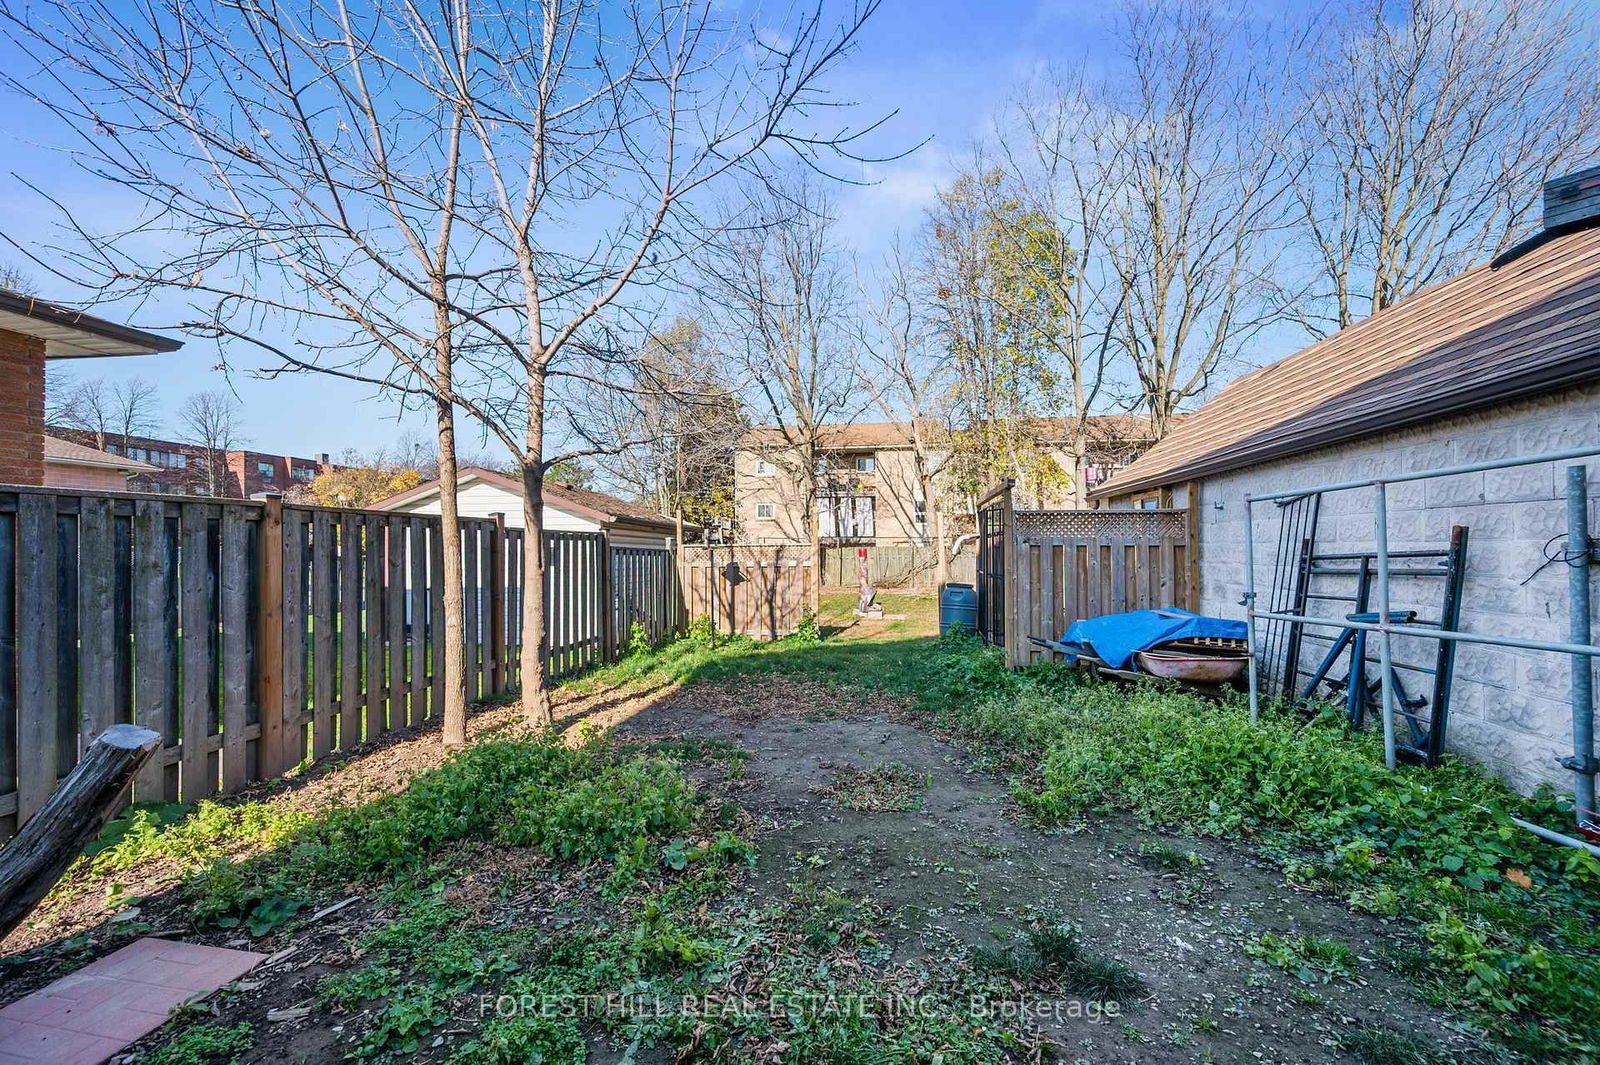
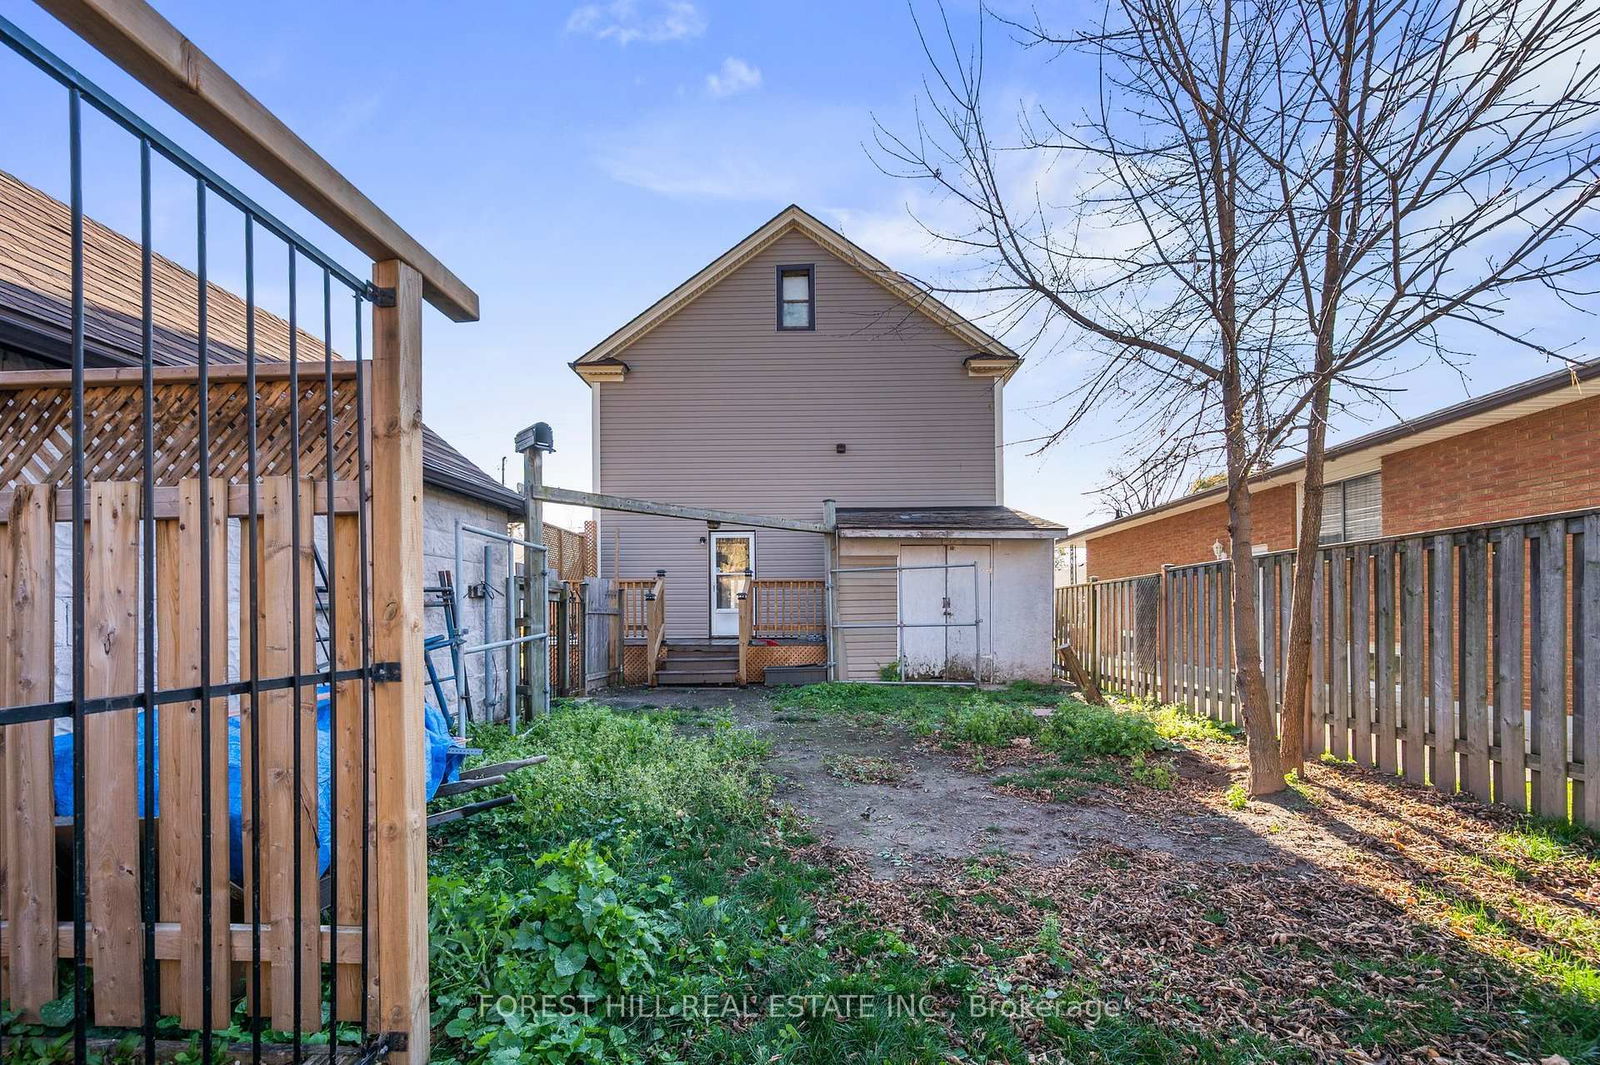
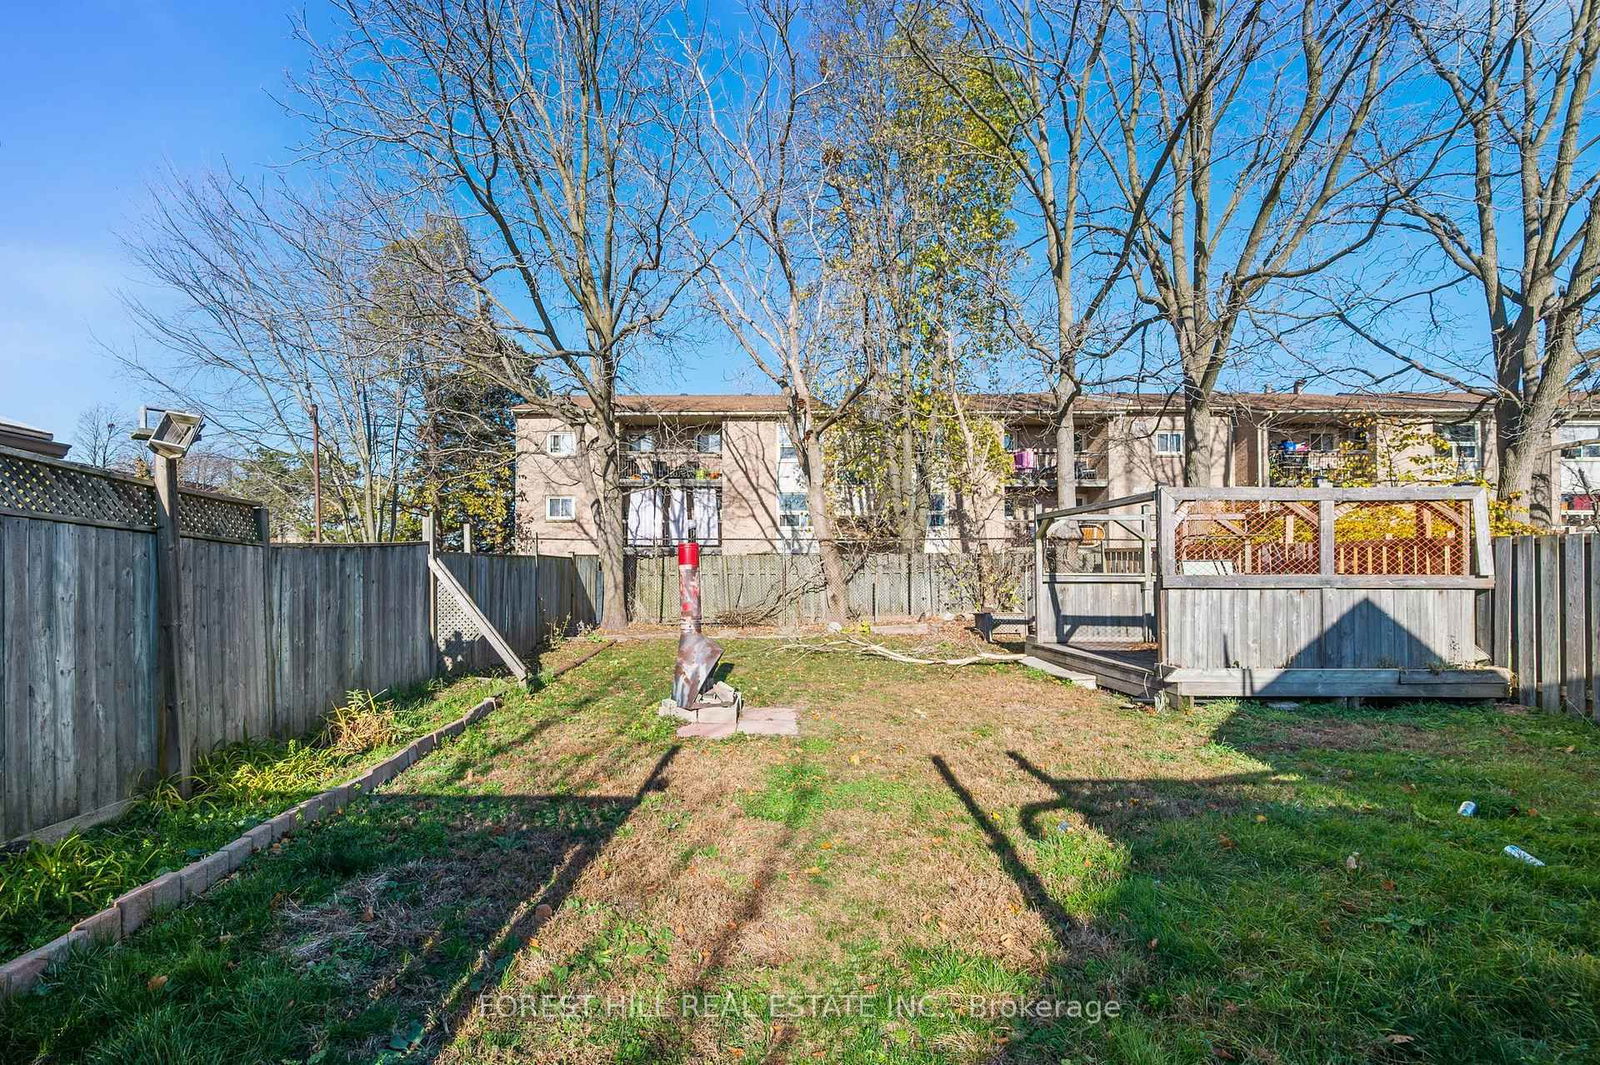
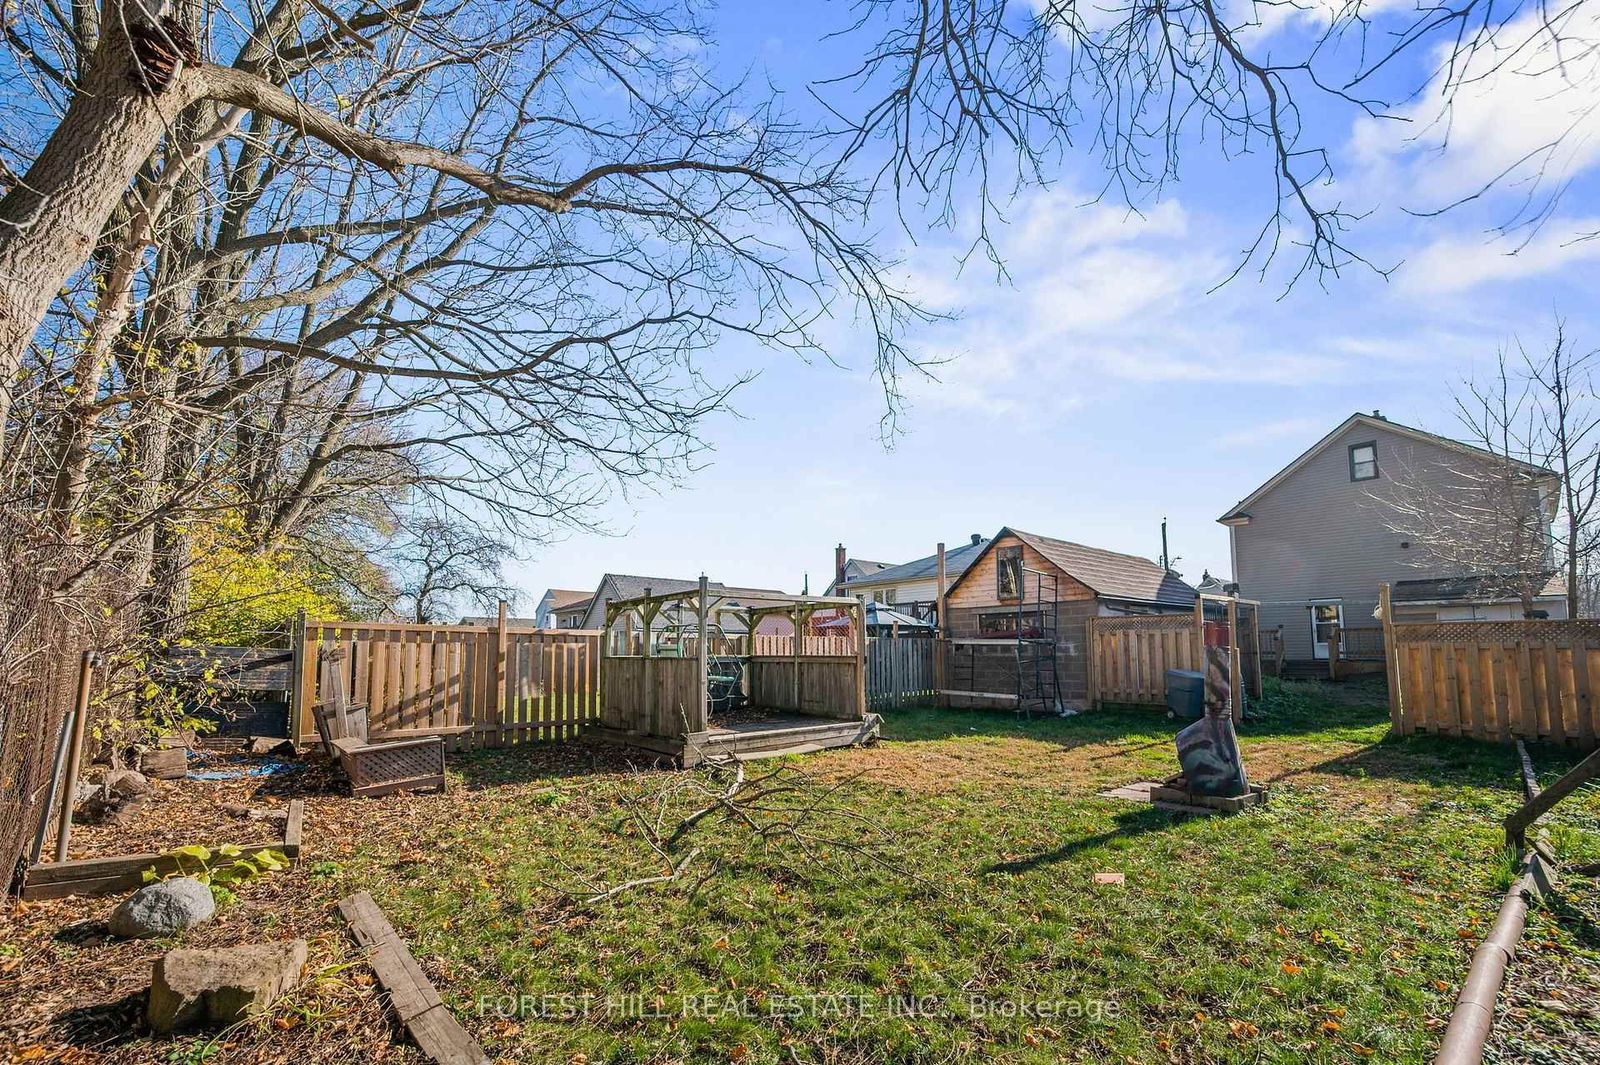
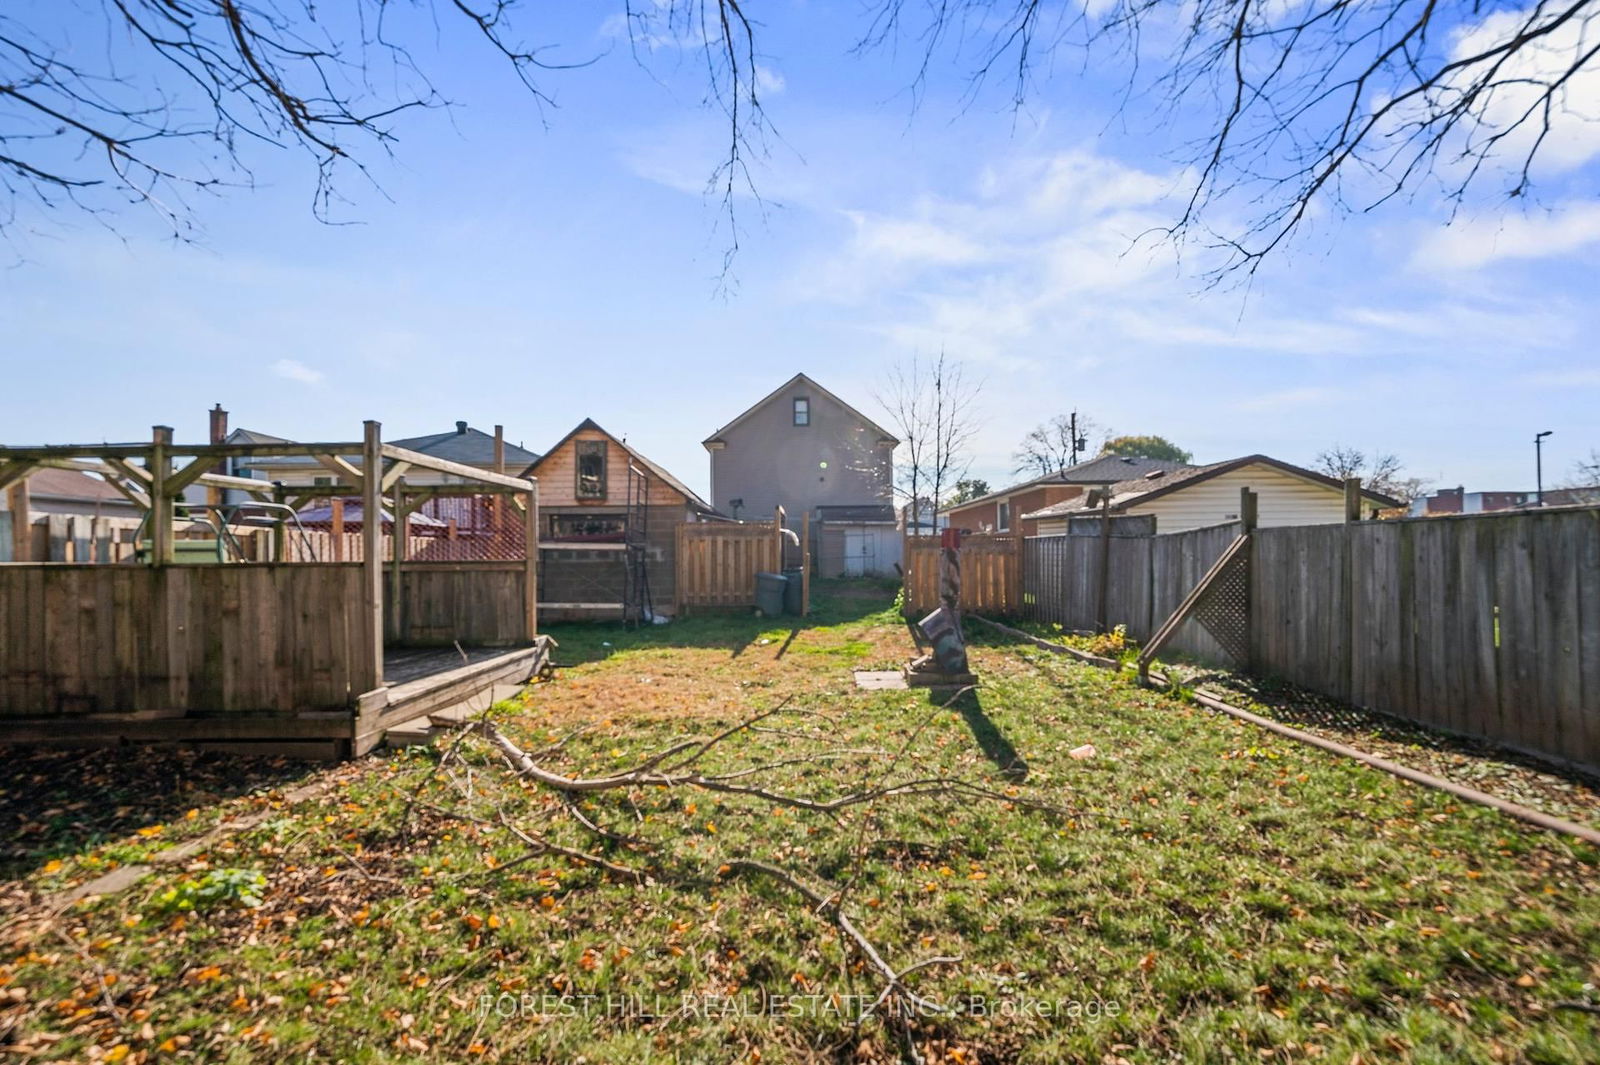
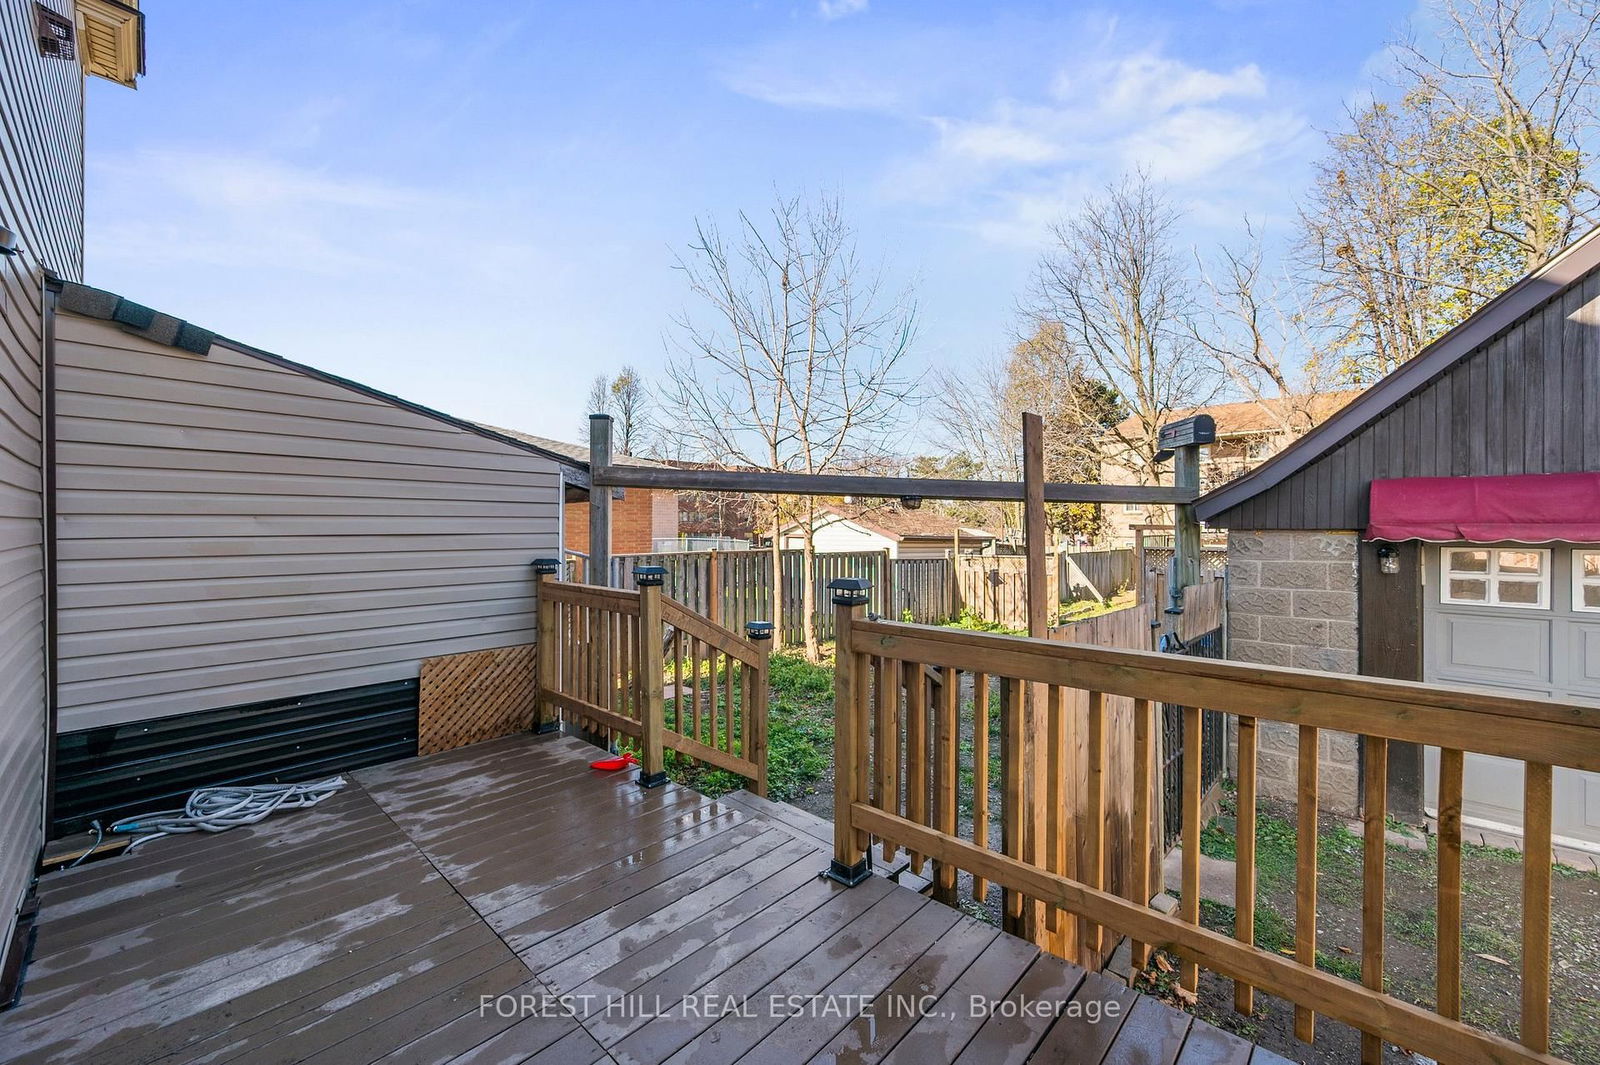
Discover the potential in this charming income producing duplex, ideally situated in the heart of downtown Niagara Falls! Set on an expansive 40' x 141' lot, this property offers two spacious apartments & a detached garage that could be used as a workshop/studio. With original character intact, including wood trim, pocket doors & a grand foyer, this home is perfect for those seeking a blend of classic charm & modern convenience. The main unit is a 1bed 1 Bath (can easily be converted back to the original 2 bedroom layout) with an open-concept kitchen flowing into the living area, a dedicated laundry, a walkout to the massive backyard. Upper unit is a light filled 1bed 1bath unit with a convenient upper level laundry rm & access to an unfinished attic for extra storage or potentially a second bedroom. Additional highlights include an enclosed front porch, updated mechanicals (electrical, furnace, A/C, windows & roof), and ample outdoor space. This property offers endless possibilities and is perfectly suited to a variety of buyers. Whether you're an investor seeking rental income from both units, a co-ownership buyer purchasing with a family member or friend, or a homeowner looking to live in one unit while renting out the other, 6133 Prospect St is the ideal opportunity! **EXTRAS** Vacant possession on closing so you can charge market rents! Steps to bus stops & highway. Close to the Falls & Entertainment area, University of Niagara Falls (4342 Queen St), Niagara River & Bridge to USA
All existing appliances (in "as is" condition). All existing window coverings. All existing electrical light fixtures.
Living
Sunroom
Kitchen
Br
Living
Kitchen
Br
The graph below compares the average list price and average sale price of homes in this neighborhood by month for the last 24 months. When average sale price is greater than average list price, this may suggest a buyer's market. When average sale price is lower than the average list price this may suggest a seller's market.
The graph below illustrates the average days on market for homes in this neighborhood. The yellow area may indicate a buyer's market, the green area may indicate a balanced market and the red area may indicate a seller's market.
Sales Representative, Century 21 People’s Choice Realty Inc., Brokerage
(647) 576 - 2100